How Fear Helps Predict Stock Returns
Stocks are well known for their high volatility. Stocks respond to financial, economic, and political events in real time. The recent Brexit vote, for example, caused a sharp drop in stock prices. But the U.S. stock market was able to rebound in several days.
Going forward, it is certain that stock markets will be sensitive to events like the upcoming Federal Open Market Committee meeting (July 26-27), the ongoing presidential election, oil shocks, and so on. But it is far from certain whether we can predict future stock returns. However, an index, called VIX, may surprise investors.
VIX, or Volatility Index, calculated by the Chicago Board Option Exchange, measures the market’s expectation of stock market volatility within the next 30 days. Since it captures expected stock volatility in the near future, it is also called a fear index. The chart below shows how VIX relates to S&P 500 returns over time.
Chart: VIX negatively correlates with S&P 500 returns over time
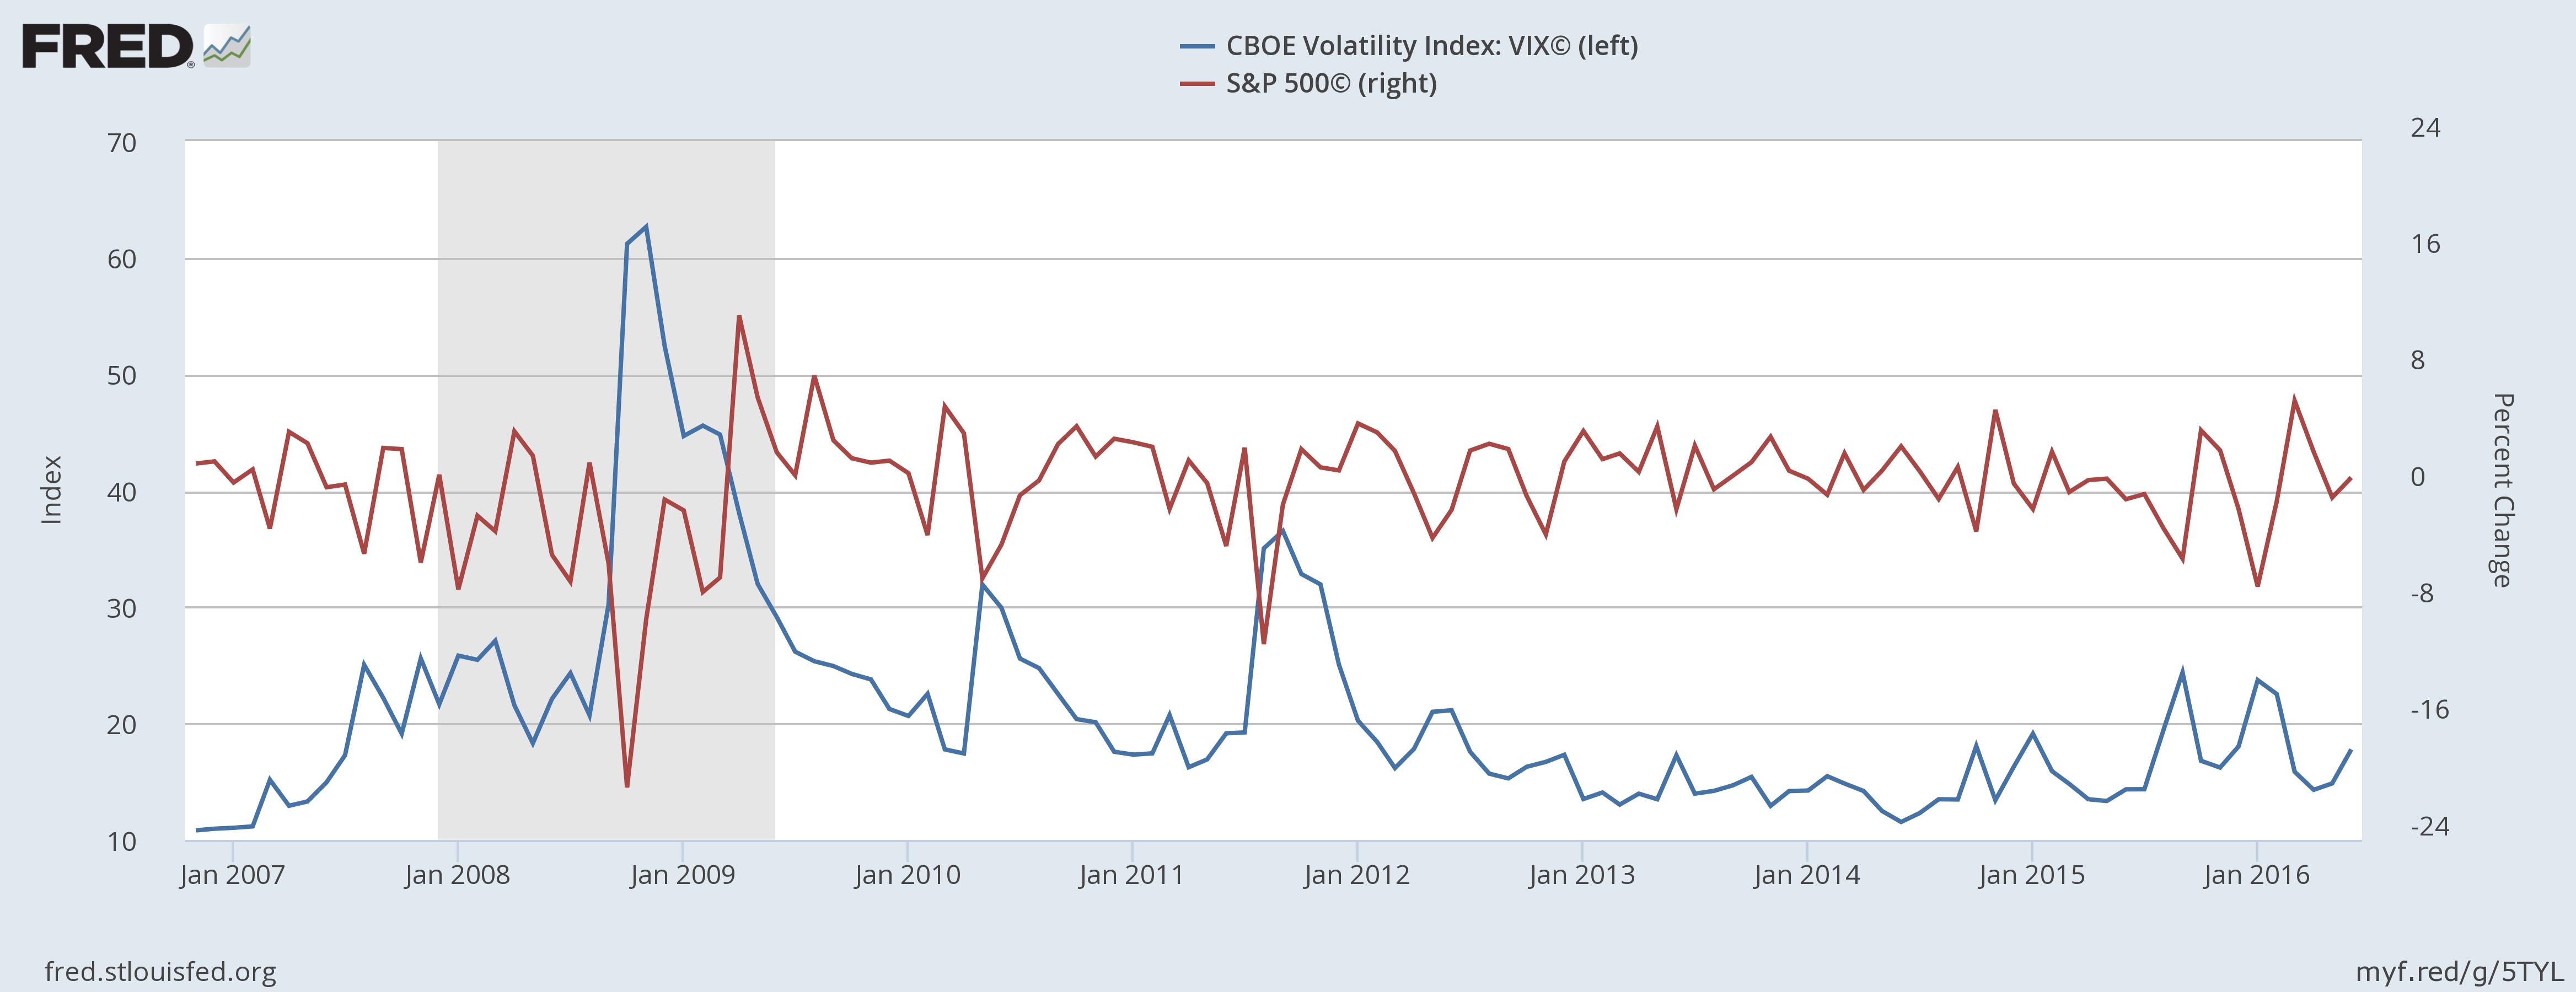
During the past decade, VIX showed a clear negative correlation with S&P 500 returns as the chart shows. When VIX reached its peak at the end of 2008, S&P 500 returns fell to the lowest over the period included in the chart. When VIX appeared rather flat from 2012 to 2015, S&P 500 experienced a period of fairly stable performance.
Recently, VIX rose to a new high of 20 right after the Brexit vote in June, which coincided with a sharp drop in stock returns. Since then, VIX has bounced back to about 12 as of today, lower than the current five-year average. This indicates that there is a good chance that stock returns in the near future will be trending upward.
Click here to sign up for the Daily Economy weekly digest!