The Myth of Spiraling Inequality


Economic inequality is on the rise in the United States — or so holds a longstanding claim of conventional wisdom. For the last decade we’ve been told that inequality is exploding — that the “top 1 percent” is approaching Gilded Age levels of income concentration and income stagnation is afflicting the lower rungs of the economic ladder. While the central planner’s first impulse usually entails asking “What can be done to stem the increase?,” this question and the proposed but likely-ineffectual solution of tax hikes are premature.
Rather, we should be asking the more fundamental questions about our inequality metrics:
(1) How reliable are our measurements of the income and wealth distributions?
(2) How much have those distributions changed over time?
(3) Is the observed change a break from historical norms?
The answer to each is an empirical question, and relates to how inequality is measured. The century-long estimate of the top 1 percent and 10 percent income shares by Thomas Piketty and Emmanuel Saez offers one possibility that many economists and political commentators have embraced. They depict a pattern of pronounced swings across the past 100 years. According to their estimates, the top 10 percent took home almost 50 percent of all income earnings in the United States prior to World War II. This figure dropped and leveled off to slightly above 30 percent for the middle decades of the last century, then rebounded between 1980 and today, where it now sits just shy of 50 percent again. A nearly identical pattern may be seen in the Piketty-Saez estimates of the top 1 percent of Occupy Wall Street ire.
These statistics provide a powerful narrative for political activism to combat inequality, but are they an accurate depiction of economic reality?
Several recent works have given us reason to question the accuracy of the Piketty-Saez numbers, especially in the last three decades. A new report from Urban Institute scholar Stephen Rose summarizes how the Piketty-Saez data compare against several alternative metrics from 1979 to the present. Several of the alternative studies account for post-tax and post-transfer income (e.g., income after Social Security and safety net payments like unemployment insurance) instead of the pre-tax measure used by Piketty and Saez. The rationale for this change is sound, as it reflects the income that people actually receive in their paychecks and place in their bank accounts, not simply what they report on their tax forms.
Other recent studies, particularly a new paper by Gerald Auten and David Splinter, account for changes in the federal tax code that affected how corporate executives and business owners structured their tax burdens. Before the Tax Reform Act of 1986, many of these individuals received their earnings through non-salary compensation that was taxed at a lower rate than the extremely progressive personal income tax. This change affected how earnings were reported, meaning any attempt to measure income inequality without adjusting for the change is likely distorted.
As Rose notes, Piketty and Saez’s widely touted inequality statistics are consistently an outlier when compared to other measures since 1979. They show income-concentration growth in the top 10 percent and 1 percent that far exceeds all other measures for this same period, including their own more recent attempts to measure the distribution through other approaches.
In short, the widely reported explosion of inequality in the past three decades is likely a myth, built upon outdated and flawed statistics.
It is not the only myth afflicting inequality measurement though. As I will detail in this article, inequality statistics going back over a century are plagued with similar data problems. These problems are sufficiently severe that they call into question the accuracy of the century-long inequality pattern at the heart of the U.S. policy discussion. Rather than the pronounced U-curve shape shown by Piketty and Saez, the corrected trend line is substantially flatter.
The Challenges of Measuring Inequality
Income distributions are usually measured from IRS records, which are themselves highly responsive to income shifting and other tax-reporting distortions that come with changing the federal tax code. But let’s assume for the sake of argument that these distortions are not an issue, and that IRS statistics can be relied upon to accurately and consistently capture year-to-year income earnings. What happens to these data then?
For starters, there are still a number of further data-construction issues that affect the way that tax statistics were historically reported. Put another way, the IRS has not always defined and measured income the same way from year to year. Therefore any measure of the income distribution over long periods of time must account for changes in IRS record keeping before we can proceed to comparisons over long periods of time.
One of the biggest changes in record keeping happened in 1944, when the IRS switched its accounting practices from measuring net income to adjusted gross income, or AGI. Think of net income as the narrower measure of the two, encompassing the earnings that remain after most itemized deductions are removed. AGI, by contrast, includes all earnings plus certain eligible itemized deductions such as charitable contributions, deductible interest payments, state and local tax payments, casualty losses, and other, miscellaneous categories that change from year to year (for example, medical expenses were added as an eligible deduction in 1942).
To complicate matters further, there are certain business expenses and property-loss deductions that are not included as part of AGI, although in some years prior to 1944 these were reported in tax statistics. Tax accounting gets even trickier when you start to consider specialized tax exemptions that apply to certain groups of people. For example, prior to 1939 most employees of state and local governments enjoyed an exemption from federal income taxes because of a quirk of 19th-century constitutional law. Congress fixed the issue, and almost overnight nearly 3 million previously exempt people appeared on the tax rolls.
Other reporting discrepancies from history include the combat-zone tax exclusion, which exempts enlisted soldiers from paying income tax when they are deployed in war zones. This exemption first applied during World War I, but was repealed in the 1920s, only to return again from 1942 to the present day.
In more recent times, as noted, tax-code changes have facilitated some discretion for how employers actually pay out income. For example, do companies pay out earnings to executives directly as salary or do they reinvest it in corporate shares, effectively creating a different type of income stream for the holders of those shares? The answer, it turns out, depends on differences in the tax rates and tax penalties associated with each. We may even expect differences in reporting to arise from something as simple as a married couple deciding to file their taxes jointly or as single filers.
There are other discrepancies that also pertain to the calculation of income shares themselves. When adding up earnings by income group or tax bracket, researchers also need to know the total amount of income earned in the United States in a given year in order to calculate the percentage. That figure usually comes from the national accounts of the United States (using the NIPA personal-income series), but it too has seen important definitional changes over the years.
For example, the NIPA series did not include income from Alaska and Hawaii until shortly before both attained statehood in 1959 even though residents of those territories had to pay income taxes in prior years. The NIPA series must also be adjusted to account for transfer-payment income such as public old-age pensions, as well as taxpayer pay-ins to the same systems — figures that shot up dramatically after the introduction of Social Security in 1936. Other adjustments that must be made to NIPA include removing tax-exempt income such as municipal bonds, excluding estimates of in-kind income that appears in national accounts but not tax returns, and fixing accounting discrepancies to make national accounts comparable to tax-eligible income.
All of these considerations amount to several opportunities for data discontinuities in both IRS records and the national-accounts baseline they are compared against. To address them requires going through the historical changes to each series with a fine-toothed comb and harmonizing the numbers so as to make an apples-to-apples comparison possible. While the commonly cited Piketty-Saez series attempts to make some of these adjustments, it also overlooks important discrepancies in tax-statistics reporting on both ends of the 20th century.
A new study by me (along with Vincent Geloso, John Moore, and Philip Schlosser) addresses these issues in the first half of the Piketty-Saez curve, covering 1917 to 1945. Among the discrepancies we account for are the aforementioned accounting swap from net income to AGI, the effects of changes to tax exemptions for public employees and combat-deployed soldiers, and historical changes affecting the consistency of income recorded in national accounts.
Taken cumulatively, these adjustments dramatically reduce top income-share concentrations in most years before 1945.
The recent study by aforementioned economists Gerald Auten and David Splinter makes similar adjustments to the Piketty-Saez series between 1960 and the present day. Auten and Splinter incorporate missing income sources from the original series by way of adjustments to national accounts. They also propose a series of successively broader adjustments to account for different assumptions about tax-reporting behavior in response to tax-code changes such as the Tax Reform Act of 1986, presenting them as a range of possible outcomes. Even the most conservative of their findings suggests that the post-1980 rise in inequality is well below that depicted by Piketty and Saez.
These studies reflect the beginnings of a much-needed investigation of tax-record data consistency and what it means for the measurement of income inequality. A comprehensive century-long assessment of these issues will likely require further work. But for a quick glimpse, note how even the most conservative of the aforementioned adjustments and corrections to the Piketty-Saez series suggest a very different pattern than the Piketty-Saez U-curve.
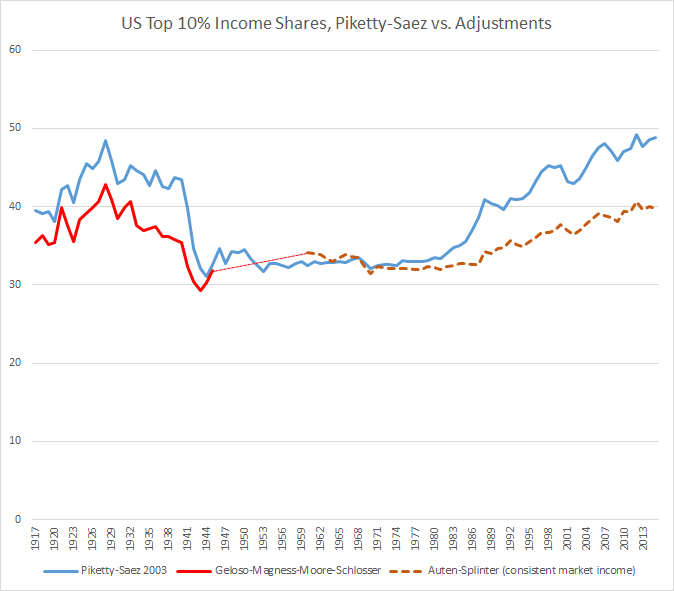
Whereas Piketty and Saez show a massive century-long swing of almost 20 percentage points in the income share of the top 10 percent, the adjusted figures show a much flatter curve with a little over half the variation. Inequality still falls and rises under the revised numbers, but at a comparatively subdued rate. Under the adjustments, the top 10 percent income share seldom strays more than 5 percentage points away from a century-long average of about 35 percent.
Perhaps instead of assuming that we’re in the midst of a surging inequality crisis, we should first settle more fundamental issues affecting the accuracy of our measurements over the past century.
Phillip W. Magness

Phillip W. Magness works at the Independent Institute. He was formerly the Senior Research Faculty and F.A. Hayek Chair in Economics and Economic History at the American Institute for Economic Research. He holds a PhD and MPP from George Mason University’s School of Public Policy, and a BA from the University of St. Thomas (Houston). Prior to joining AIER, Dr. Magness spent over a decade teaching public policy, economics, and international trade at institutions including American University, George Mason University, and Berry College. Magness’s work encompasses the economic history of the United States and Atlantic world, with specializations in the economic dimensions of slavery and racial discrimination, the history of taxation, and measurements of economic inequality over time. He also maintains an active research interest in higher education policy and the history of economic thought. His work has appeared in scholarly outlets including the Journal of Political Economy, the Economic Journal, Economic Inquiry, and the Journal of Business Ethics. In addition to his scholarship, Magness’s popular writings have appeared in numerous venues including the Wall Street Journal, the New York Times, Newsweek, Politico, Reason, National Review, and the Chronicle of Higher Education.