College Destinations: Beyond the Campus
The CDI captures 12 key elements off campus that contribute to a great college experience. The rankings can tell you which cities offer great entertainment, high income potential, or inexpensive housing. The CDI then tallies up the rankings for a destination’s final score.
AIER’s CDI doesn’t address which schools have the most Nobel Prize winners, the nicest dorms, or the best pre-game parties. Instead, it captures a school’s surrounding environment that can have a huge impact on the college experience and professional opportunity. Where can art students study the classics in person? What cities offer the best opportunities for local scientific research? What percentage of the population is highly educated? What cities foster a culture of entrepreneurship? How much is an apartment going to cost? Can I get into downtown easily?
The CDI looks for cities and towns that offer it all. It can help narrow the college search by highlighting destinations that offer students an environment that fits their desired college experience.
Calculating the CDI
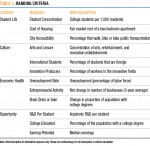
The 2014 CDI reviews 271 metropolitan statistical areas (MSAs) with greater than 10,000 students. These destinations are classified based on population: College Towns, Small Metros, Mid-Sized Metros, and Major Metros. The CDI ranks the 75 best destinations based on 12 measures that fall into four categories: economic health, student life, culture, and opportunity (See Table 1 on page 2).
There were several improvements in the 2014-2015 CDI, some of which impacted overall rankings. The methodological improvements, their impacts, and the effects of underlying data are summarized below.
Expanded Universe
One of the most important improvements that we made to this year’s CDI was expanding the Index’s universe of destinations. By reducing the minimum size of student population from 15,000
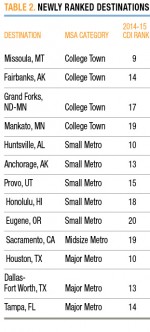
to 10,000, we are able to include more destinations and produce a more complete CDI. Two destinations, Missoula, Montana and Fairbanks, Alaska, entered the rankings for college towns because of this change (See Table 2 on page 3 for all newly ranked destinations).
Missoula, now ranked 9th in College Towns, is home to the University of Montana, a public research university. Missoula ranks first among all ranked College Towns with 103 arts and leisure establishments per 100,000 residents. Missoula is also tops among the ranked College Towns in our measure of Brain Gain, boasting an 18 percent improvement in the share of the population with college degrees.
Fairbanks is ranked 14th in College Towns. It is the home of the University of Alaska Fairbanks, the flagship of the University of Alaska system. The university is home to seven major research units, primarily focusing on agricultural, biological, and environmental research. Fairbanks was the top ranked destination among the top 20 College Towns in Earning Potential, suggesting that well-paying after-college opportunities exist in the area. Fairbanks also ranked second among the top 20 College Towns with 74 arts and leisure establishments per 100,000 residents.
Measure Improvements
Our measure of Entrepreneurial Activity now uses a three-year moving average rather than a single year of data, which helps control for year-to-year randomness. This improvement had the most distinct effect on destinations that saw more yearly unpredictability in the number of businesses opening and closing. For example, Waterloo, Iowa, was ranked 19th in College Towns last year on the strength of its 2010 increase of 27 businesses per 100,000 residents, tops amongst ranked College Towns. This was a one-year anomaly. In 2009, Waterloo saw a net decrease of 48 businesses and in 2011 saw a net decrease of 31 businesses. Waterloo’s three-year average annual decrease in businesses is low enough that it falls from the top 20.
We also improved our measure of Innovation Producers to specify a narrower universe of innovative careers. The measure now looks specifically at careers in computers, engineering, math, architecture, science, and the arts instead of a broader measure that included all management, business, science, and arts occupations. Huntsville, Alabama was the most visible benefactor of this improvement. Huntsville is the home for rocket-propulsion research in NASA and the Army. Huntsville became the 10th ranked Small Metro on the strength of its second-place ranking for Innovation Producers amongst the top 20 Small Metros.
Changes in Calculations
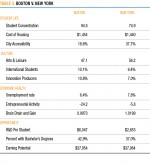
In the previous CDI, Boston performed better than New York City in eight of the 12 measures yet New York was ranked 1st among Major Metros. This was largely a result of significant outperformance by New York City on the measure City Accessibility. This year we changed the way we calculated our results in order to highlight the differences between destinations in the same city size classification. Because of this, Boston pulled ahead of New York in the rankings.
Measures in the CDI are gathered in disparate units. For standardization of data across measures, we normalize the data to give them a common unit and make them comparable. We use a basic statistical method that relies on the average and the standard deviation, a measure that tells how spread out the data is from the average.
In general, Major Metros tend to perform better than other destinations in City Accessibility, and New York outperforms all other Major Metros on this measure. In previous years, the standardization method was applied to the entire universe of destinations. This year, we performed the standardization within each of the four city size classifications.
One result of this improvement is that New York City is no longer such an immense outlier on the measure of City Accessibility, since its public transit ridership is more similar to its peer group of Major Metros. While New York City still performs well across many measures, Boston took over the 1st place ranking in Major Metros in part because of this process improvement. Boston outperforms New York in seven of 12 measures, in some cases quite noticeably (See Table 3).
New Patterns Revealed
One clear pattern that emerged in the rankings this year is that the top-ranked Small Metro and College Town destinations are more similar to one another than the top destinations in Mid-size and Major Metros. The top five Small Metros and College Towns all rank in the top 20 percent for their size in several measures: Student Concentration, International Students, R&D per Student, College Educated, and City Accessibility.
There are no measures for which this is true for Mid-size or Major Metros. In contrast to the smaller college destinations, rankings for Mid-size and Major Metros are more likely to be driven by one or two category outliers as opposed to the across-the-board outperformance. This means that students attracted to the Mid-size and Major Metro destinations should look “beneath the hood” of the CDI to understand the contribution that each factor makes to the final ranking.
Part of the explanation for this pattern is that College Town and Small Metro destinations are more competitive than the other classifications because there are more destinations classified this way. It is harder to break into the top five in those categories. Those that do reach the top five are likely to excel in many of the measures.
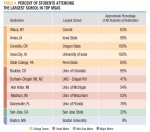
The pattern among top Small Metros and College Towns is also evidence that these destinations may be small enough that one or two large schools significantly affect the local economies and the makeup of the population. All of the top five College Towns and Small Metros are home to at least one large and well-known institution. In these circumstances, students make up a larger portion of the destination population (See Table 4). A large university in a small town can have an enormous effect on many of our measures.
For students and parents looking for a small-town feel, it is important to recognize the specific institutions that drive these rankings. For students that prefer a larger city, there are many more institutions that contribute to the atmosphere. Check out our website for individual destination measures and the colleges and universities that can be found in those destinations.
How to Use the CDI
AIER releases the CDI in a brochure that is available for download on our website as well as in paper form. The brochure lists the top 75 destinations and includes how those destinations performed in each of the 12 measures.
It is important for individuals to keep their own preferences in mind when using the CDI as a tool. Our brochure provides all data for the ranked destinations. Where a student has a strong preference toward one measure or another, he or she can use the brochure to find the best fit. We have weighted all of the different measures equally, but prospective students can place more importance on those that matter more to them by looking at the data published in the rankings.
The 2014-2105 CDI looks at 12 measures of Student Life, Culture, Economic Health, and Opportunity that we hope students and parents will use to isolate desirable destinations and improve the college selection process.
Click here to download your copy of the 2014-2015 College Destinations Index.


