Everyday Prices Higher in June, While Grocery Prices Decline.
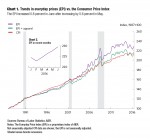
AIER’s Everyday Price Index rose 0.8 percent in June from May, primarily driven by the increases in energy-related prices, which increased for the fourth month in a row. The EPI measures changes in prices that people see in their everyday purchases, such as groceries, gasoline, utilities, and personal care services. Over the past 12 months, the EPI dropped 1.3 percent.
The EPI including apparel, a broader measure, posted a 0.6 percent increase in June and a slightly lower 1.2 percent drop over the past 12 months than the broader EPI measure. Both EPI measures exclude prices of infrequently purchased, big-ticket items (such as cars, appliances, and furniture) and prices that are contractually fixed for prolonged periods (like housing).
The more widely known price gauge, the Consumer Price Index reported by the Bureau of Labor Statistics, increased 0.2 percent in June on a seasonally adjusted basis. The CPI prior to seasonal adjustment increased 0.3 percent for the month and 1.0 percent over the past 12 months. The EPI is not seasonally adjusted, so we compare it with the unadjusted CPI.
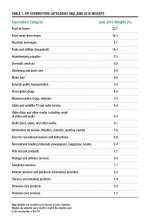
The EPI increase in June, similarly to May, was driven primarily by energy costs. Motor fuel prices jumped 4.4 percent in June, and household fuels and utilities rose 2.5 percent. The increase in energy-related prices was partially offset by a 0.4 percent drop in grocery prices from May to June. Groceries are the largest category within the EPI, accounting for 22.7 percent of everyday purchases, while gasoline accounts for only 9.8 percent. Thus a small decline in grocery prices can offset higher gasoline prices.
Grocery prices have fallen 1.3 percent over the past 12 months with a decline across most major categories. In recent years, grocery price increases remained well below their long-term historical average of 2.3 percent. Lower prices for agricultural commodities are likely behind this trend. Agriculture prices as measured by the GSCI Agriculture Index have dropped 10.4 percent over the past 12 months and the producer price index for food declined 2.3 percent in the 12 months to June.
The decline in grocery prices contrasts with the continuous rise in prices for food consumed away from home (i.e. in restaurants and similar establishments). Prices for food away from home rose 0.2 percent in June and 2.6 percent over the past 12 months, in line with their long-term historical average of 2.8 percent. The actual cost of food is a smaller percentage of total restaurant costs (e.g., rent, labor, insurance), thus a decline in prices for agricultural commodities does not drive the restaurant prices down quite as much as it does the grocery prices.
The divergence in trends between grocery prices and restaurant prices started around 2009. Since then, grocery prices grew, on average, 1.6 percent per year, while restaurant prices grew 2.5 percent. Prior to 2009, the two food categories exhibited similar pace of price increases – around 3 percent per year. The recent data appears to continue these divergent trends.


