Inflation

Scorecard
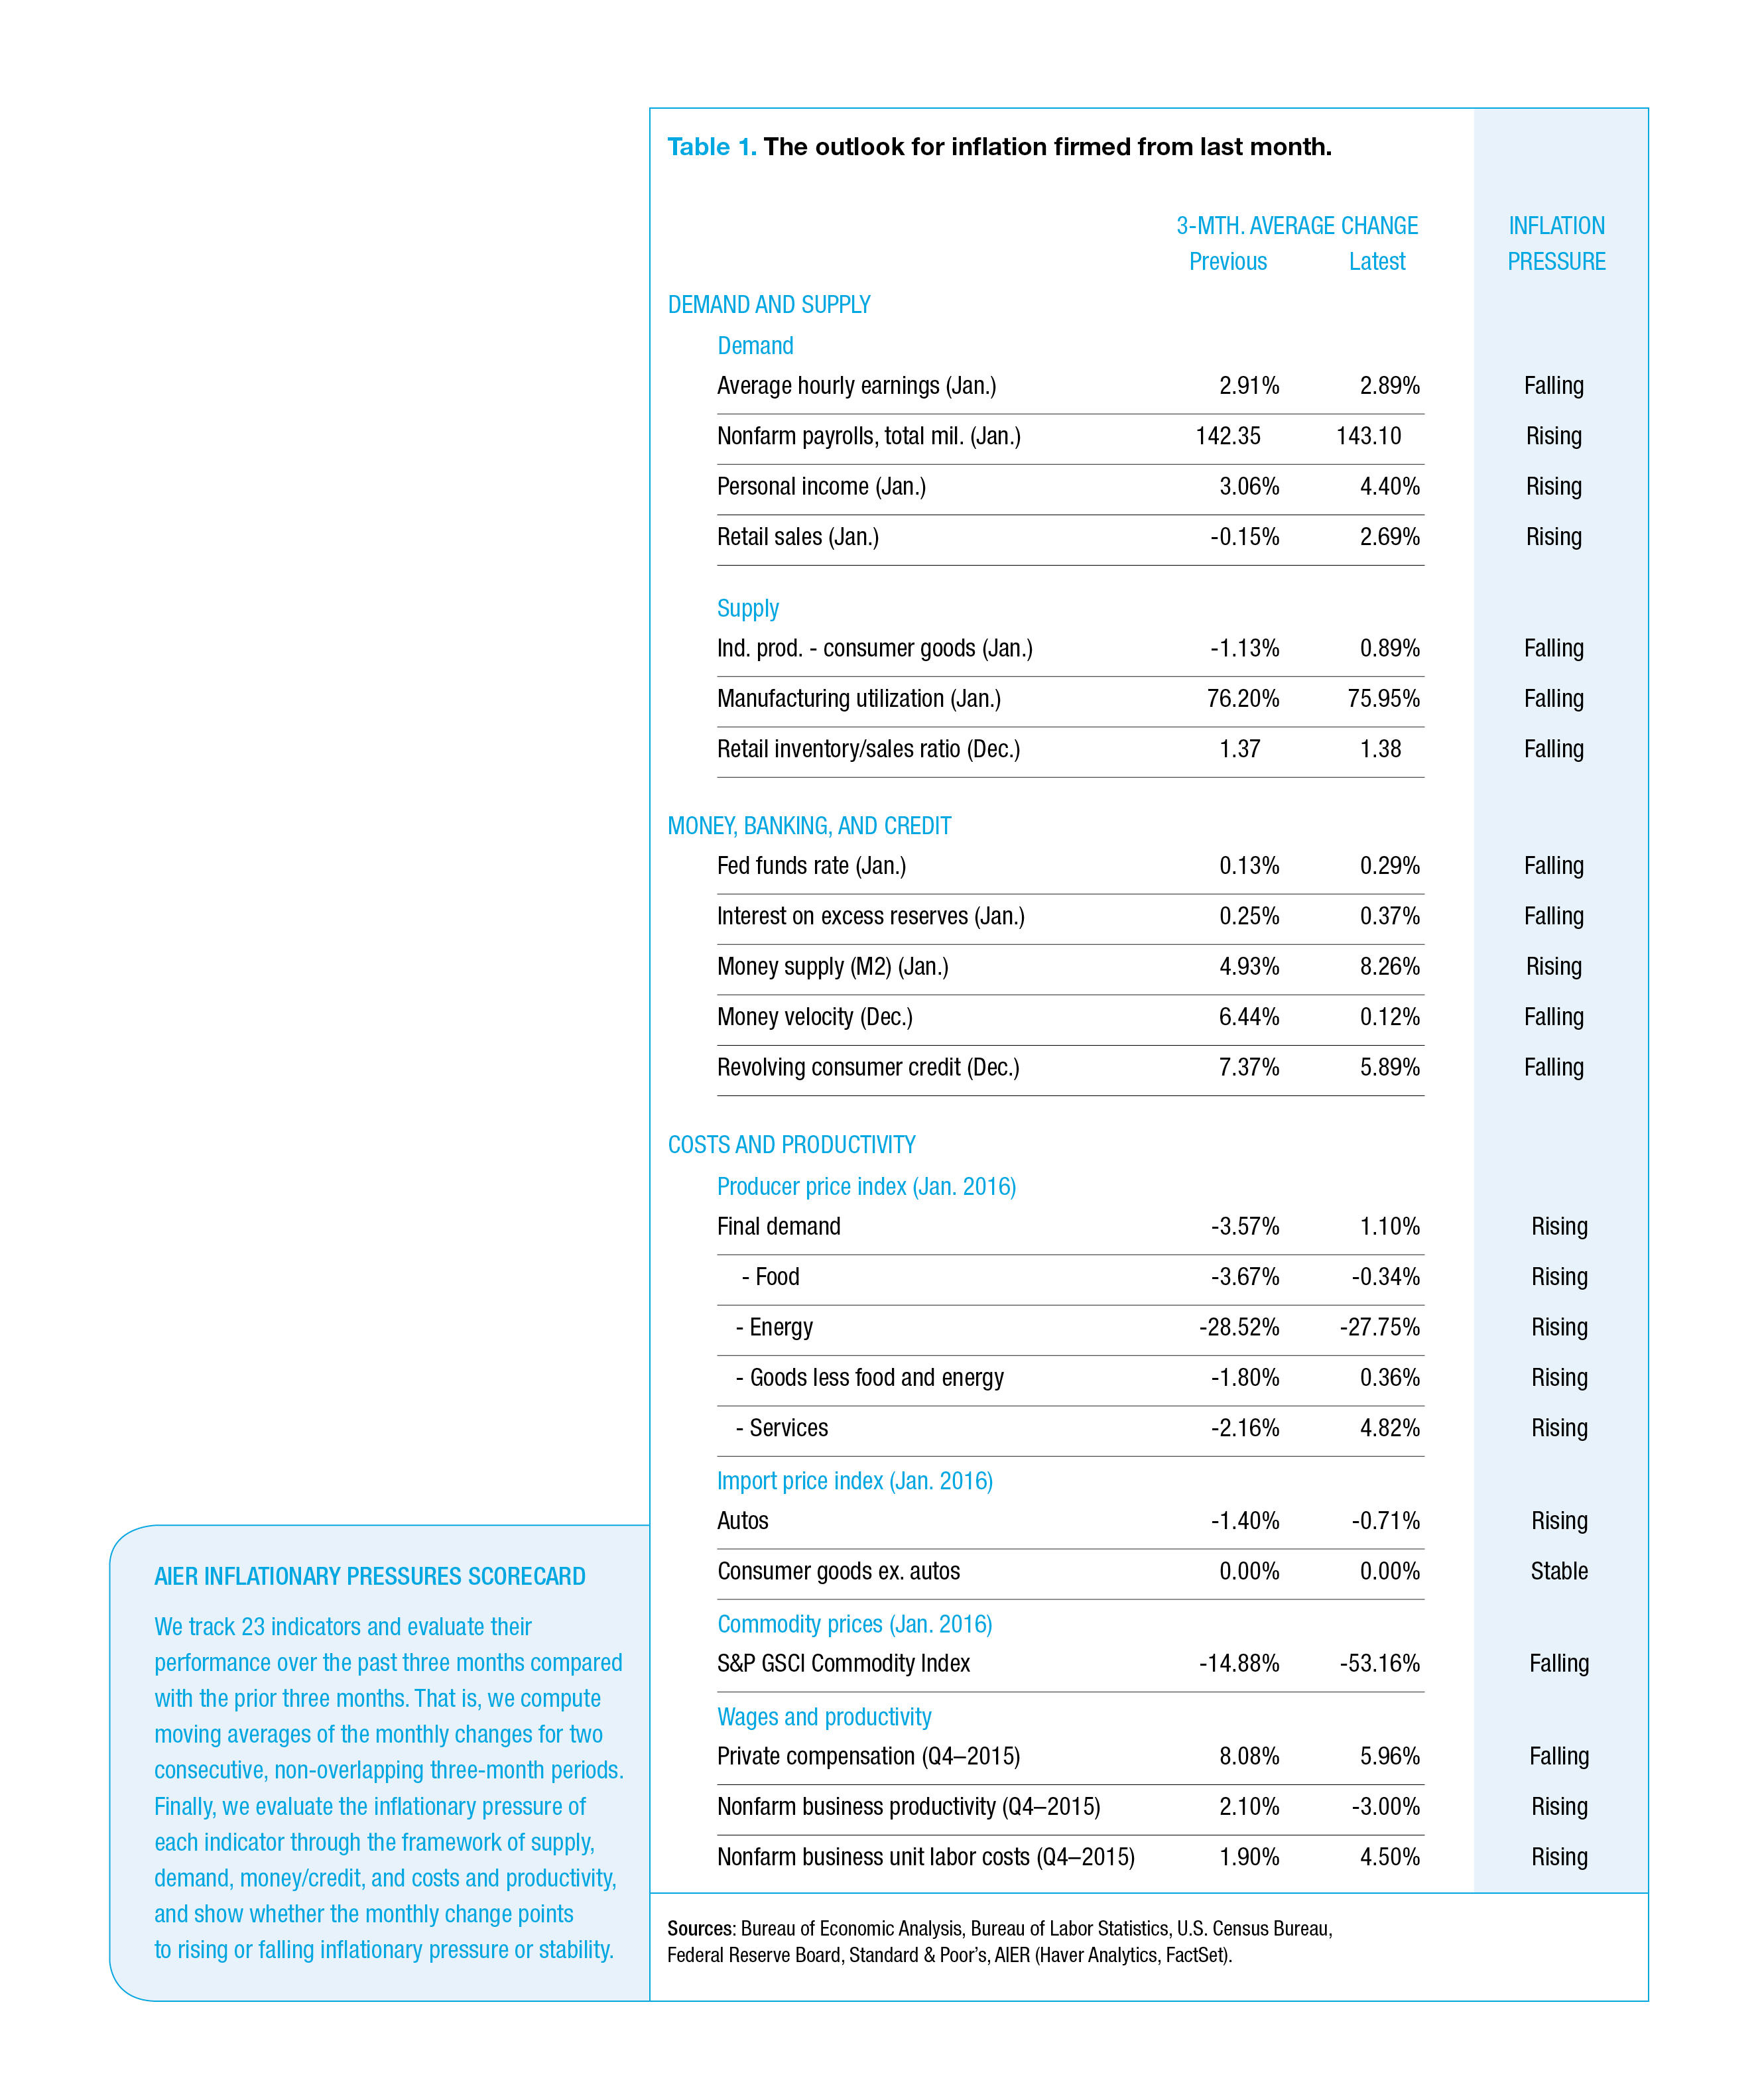
Price pressures firmed significantly in our Inflationary Pressures Scorecard, with 12—a net gain of four—pointing to rising pressures and 10 suggesting falling pressure, down four. One indicator remained stable.
Even so, the Scorecard is only slightly tilted toward rising inflationary pressures. Balanced supply and demand indicators suggest that pipeline pressures may not be passed along very easily by producers and retailers. Wages and productivity are key. As the labor market tightens, higher wages become more likely. Faster productivity growth, price increases, lower profits, or a combination of these can mitigate that pressure.
Ten Scorecard indicators switched direction, with seven going to rising from falling pressure and three to falling. Trends in supply and demand suggest rising pressure if they persist.
Our money, banking, and credit indicators had offsetting changes, suggesting falling pressure. Finally, a net of eight cost and productivity indicators pointed higher. Pipeline pressures measured by the producer price index, or PPI, either rose, or in two cases, fell less quickly. As with the Consumer Price Index, services provide the strongest pressures.
Consumer Price Index Analysis
Overall consumer prices were unchanged in January. However, that result hides some influential details. The plunge in crude oil prices that began in mid-2014 continues to restrain the Consumer Price Index, a trend we have highlighted recently. The CPI for energy fell 2.8 percent in January and 6.5 percent over the past year. Food prices remained flat in January and rose a meager 0.8 percent in the past year.
The other significant ongoing trend is the sharp divergence between core goods prices, which have been essentially flat for most of the past two decades, and core services, which have been rising at a pace well above the Federal Reserve’s 2 percent annual inflation target. The big surprise in January was that the core goods index rose a robust 0.2 percent on widespread gains. Apparel prices climbed 0.6 percent while new vehicle prices increased 0.3 percent.
The weak price pressures suggested by our Scorecard should be weighed when evaluating the latest CPI data and its effects. Despite seasonal adjustment, January data can be unusually volatile, particularly for consumer goods like apparel. Retailers often react to the strength or weakness of the prior holiday shopping season with deep or shallow discounts. A few more months of data will be necessary to determine whether core goods prices are truly starting to rise at a faster pace or whether January was an outlier.
The other key trend, the persistent pace of gains in core services prices, continued in January with a 0.3 percent increase. Core services rose 3 percent over the past year. The rate remains somewhat above its long-term average of 2.5 percent annual growth over the past five years and 2.8 percent over the past 20 years. While shelter, medical-care services, and transportation all contributed to the monthly rise, education was unchanged, bringing the three-month growth rate down to just 2.3 percent, well below the long-term average pace of 3.6 percent over five years and 5.1 percent over 20 years.
Click here to receive email notifications when the latest Business Conditions Monthly is available.
Everyday Price Index
AIER’s Everyday Price Index fell 0.1 percent in January from December and 0.3 percent over the past 12 months. The EPI measures the change in prices that people pay for routine purchases, such as groceries, gasoline, utilities, and housekeeping supplies.
The more widely known Consumer Price Index, reported by the Bureau of Labor Statistics, increased 0.2 percent in January and has increased 1.4 percent over the past year, prior to seasonal adjustments. Since the EPI is not seasonally adjusted, the unadjusted CPI is the proper point of comparison.
The decline in the EPI stems primarily from a drop in energy-related prices. Motor fuels slid 4.5 percent in January and 7.7 percent over the past 12 months. Home heating oil has dropped 20.7 percent over the past year, while natural gas has registered a more modest decline. Because the EPI assigns a greater weight to energy, the decline in energy-related prices has a much larger effect on the EPI than on the CPI.
Over the past 15 years the EPI has tended to rise faster than the CPI. The pattern has changed recently, with the EPI falling while the CPI inches higher.
Next/Previous Section:
1. Overview
3. Inflation
6. Pulling It All Together/Appendix