Inflation

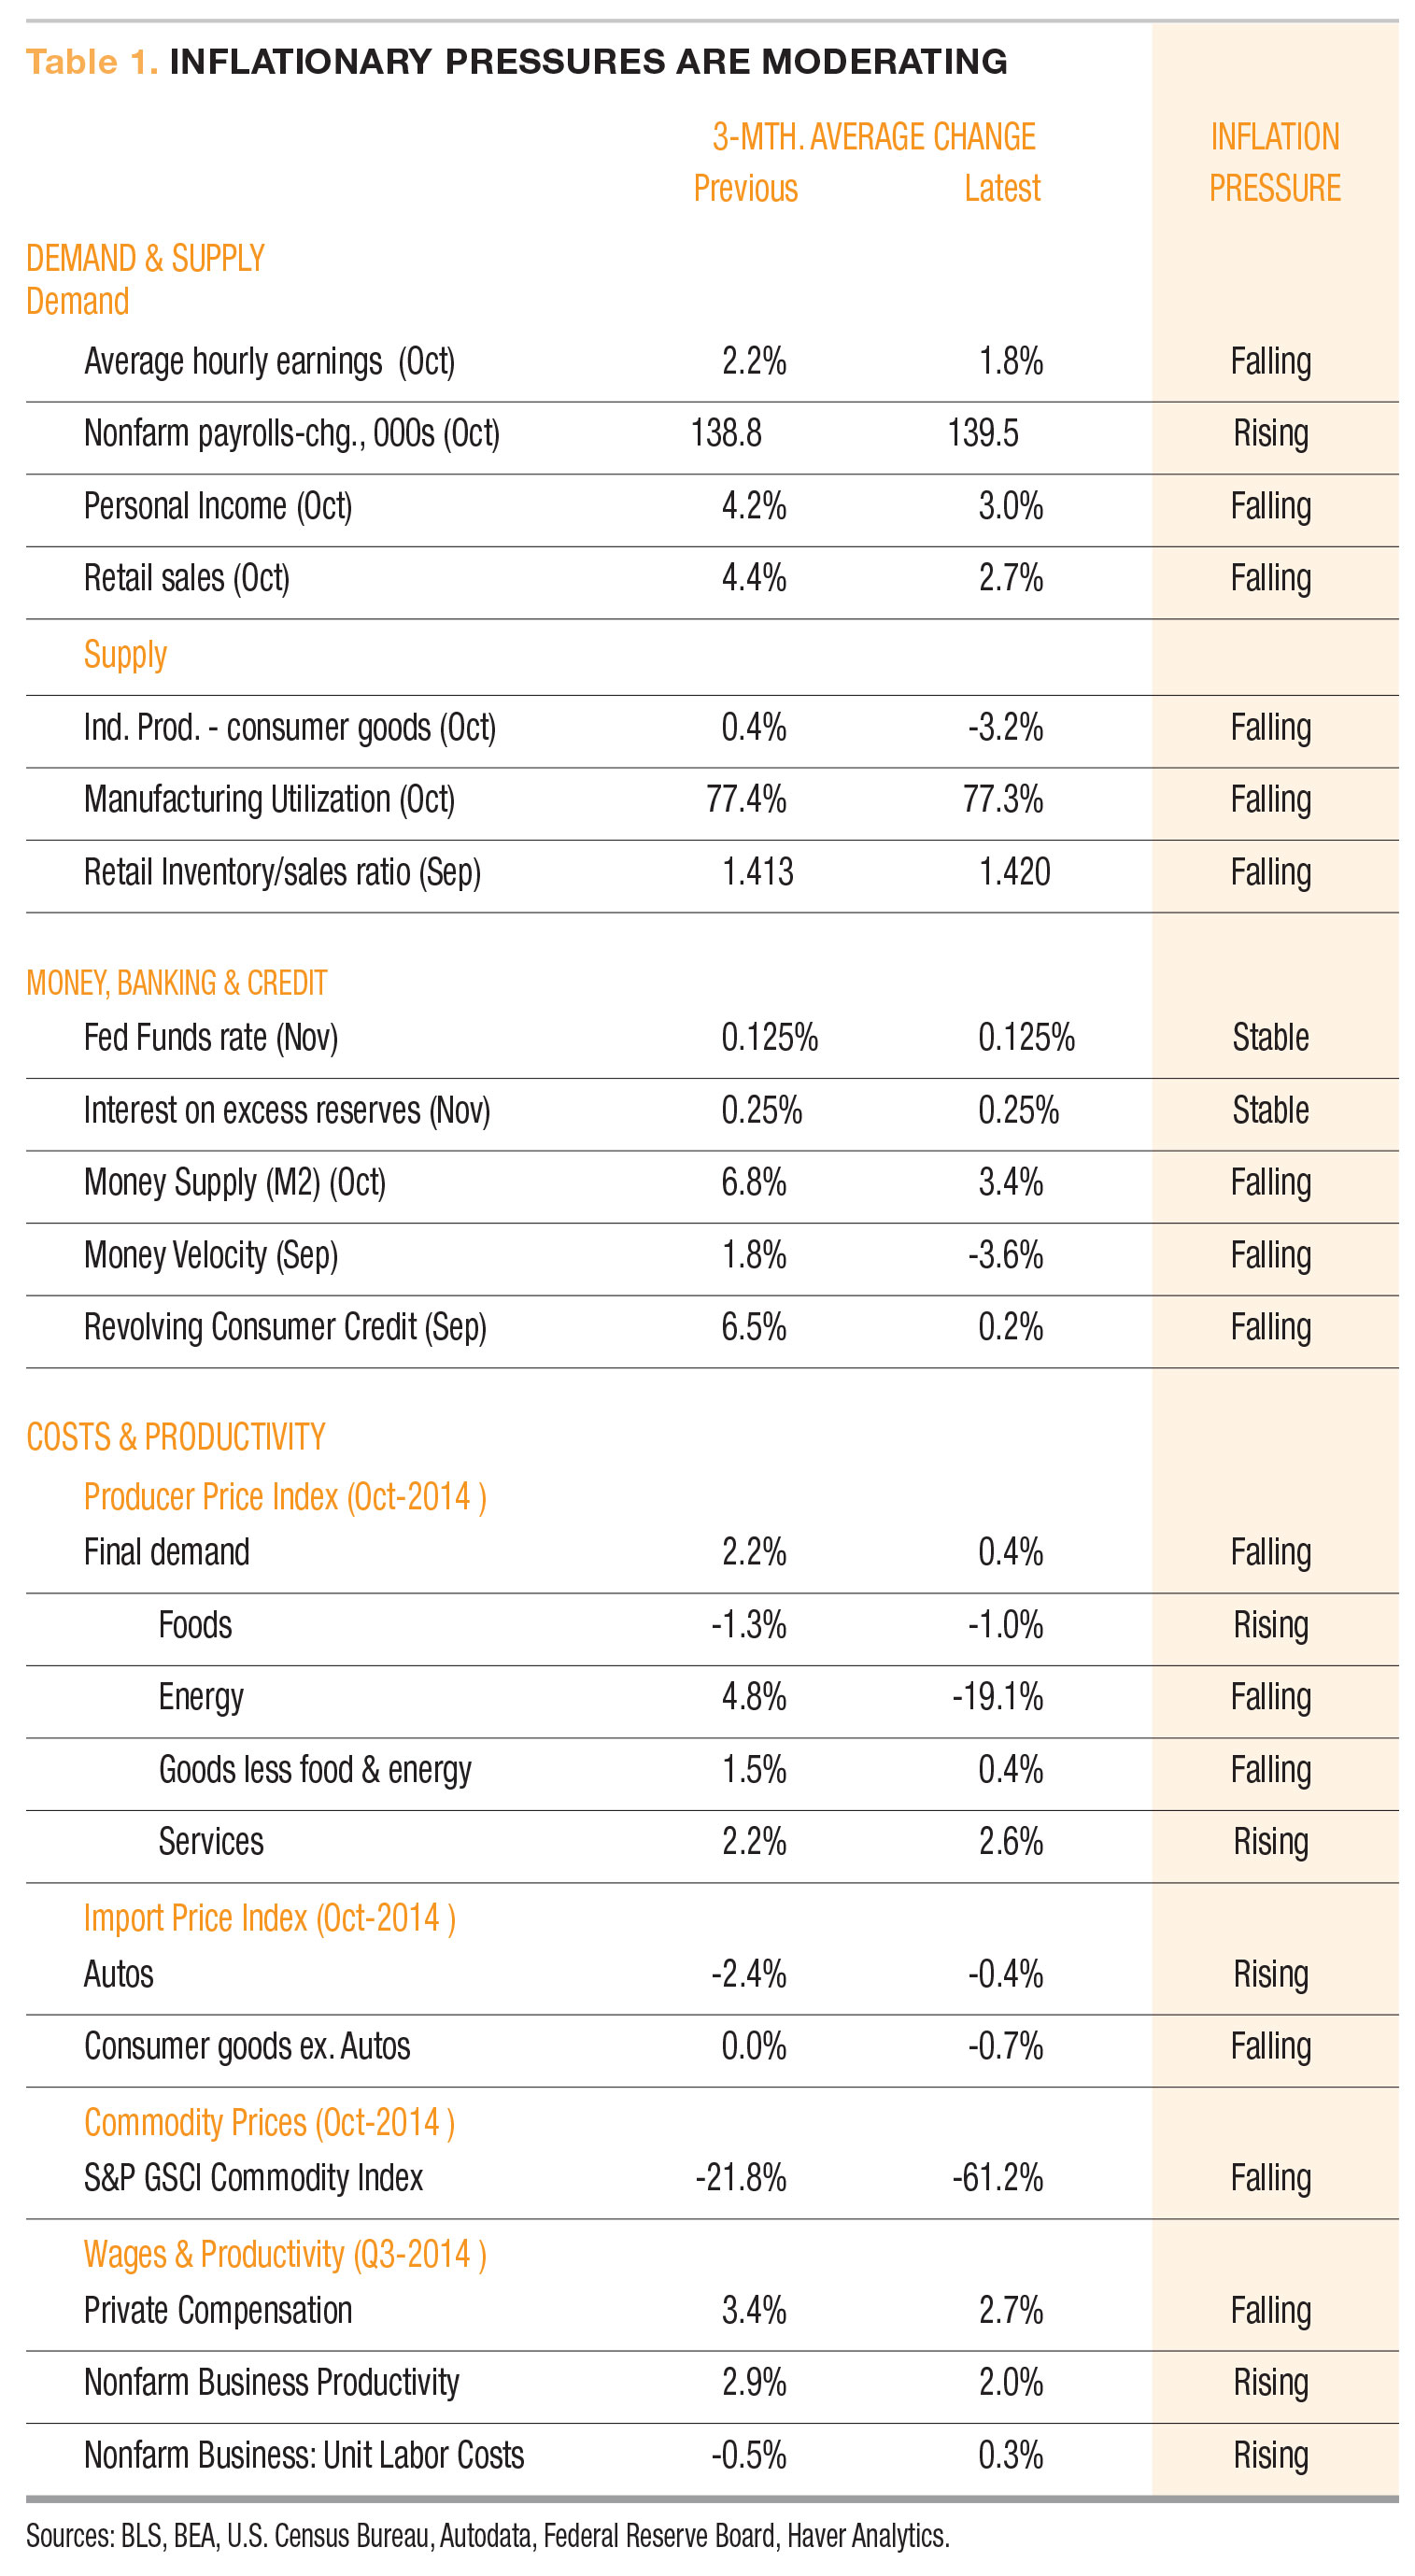
In our latest review of the scorecard, 15 of the 23 indicators show falling inflationary pressures, two are stable and six show increases (Table 1). Overall, our scorecard suggests generally moderating inflationary pressures and supports our view that price changes are likely to remain tame in the months ahead.
Even with an expectation for just modest price gains in 2015, we are focused on three key areas for possible increases in inflationary pressures: wage costs from a tightening labor market, the potential for accelerating productivity to offset those influences, and the impact of weak global growth on the dollar and commodity prices.
More specifically on wages and productivity: wages, as measured by average hourly earnings, have been rising at about a 2 percent annual rate over the past four years, below the average 3 percent rate over the past thirty years. Productivity has averaged about 2 percent per year over the past 60 years, while over the past four years, productivity growth has averaged less than 1 percent per year.
CONSUMER PRICES
Price increases as measured by the Consumer Price Index (CPI) remain slight by historical measures. Total CPI was unchanged in October as a sharp decline in energy costs offset small increases in other goods and services. Over the past 12 months, the CPI has risen 1.7 percent, below a 2.4 percent 20-year average (Table 2).
Because food and energy prices tend to be more volatile and subject to influences beyond typical economic forces such as severe weather patterns or geopolitical forces, we believe it’s important to exclude those components by focusing on the core CPI. This gauge accounts for almost 77 percent of the total CPI. The core CPI rose 0.2 percent in October and 1.8 percent for the past year. That’s 0.3 percentage points below a 2.1 percent average annual increase over the past 20 years.
A further disaggregation of the measure into core goods and core services provides a deeper understanding of price increases in the U.S. Core goods have risen at an average annualized rate of just 0.3 percent over the past 20 years and are actually down 0.2 percent in the last 12 months. Core services have risen 2.5 percent over the past year and averaged 2.8 percent annual gains over the last two decades.
This significant long-term divergence between core goods prices (+0.3 percent) and core services (+2.8 percent) is an important element in the outlook for 2015. Critical questions are: Will core goods prices continue to fall? Will prices for core services accelerate, hold steady or decelerate? Monitoring these areas and the forces behind price increases are major focal points for next year.
EVERYDAY PRICE INDEX
AIER’s Everyday Price Index (EPI) decreased 1.0 percent in October because a drop in energy prices offset gains in food costs. Yet the CPI did not change on a month-to-month basis in October. The difference between the two indexes stemmed from increases in housing and education costs, which are not reflected in the EPI gauge. The EPI measures the prices of frequently purchased goods and services, therefore, infrequent expenditures on things like housing and education are not included. Over the past year through November, the average retail price of gasoline slid 15 percent, taking pressure off household budgets. However, food prices continued to rise. Meats, fish, poultry and eggs climbed 8.3 percent this year, while dairy products gained 5.6 percent.