Investing


Fixed Income
In general, bond yields tend to rise as economic growth accelerates. Faster growth increases the risk of a pick-up in inflation, which reduces the value of a fixed-income investment. An accelerating expansion can also lead the Federal Reserve to raise its federal funds target rate, which would also undercut the value of a bond or other fixed-income investment.
Corporate bond yields reflect both economic conditions and expectations of the risk of default for each issuer. Overall economic conditions can contribute to the risk of default for individual companies—slow economic growth or a recession increase the likelihood of default, while stronger growth tends to reduce it.
If corporate bond yields are analyzed relative to Treasury securities—calculating the difference, or spread, between the yields—we can isolate the default risk component implicit in the investment. Corporate spreads over Treasurys tend to widen during periods of economic weakness as default risk rises, and they tend to narrow during times of economic strength as the risk of default declines.
Before the Great Recession, corporate bond yields fluctuated between 1.5 and 2 percentage points higher than the yield on 10-year Treasury notes. During the recession, that spread widened to 6 percentage points. More recently, in 2014 the spread narrowed to about 2.25 percentage points as GDP growth strengthened during the second and third quarters. Since then, economic growth has been erratic, hitting a low of 0.5 percent on an annual basis in the first quarter of this year. It is interesting that the yield spread widened from mid-2014 through early 2016 but has sharply reversed course in the past several weeks. This suggests that bond investors see a lower default risk in the months ahead (Chart 5).
Commodities
Commodity prices, like bond yields, tend to be sensitive to economic conditions. While commodity markets are more global in nature, meaning they are more sensitive to global economic developments than U.S. corporate bond yields, they are still closely tied to the U.S. economic outlook.
Two commodities that are particularly sensitive to changing economic conditions are copper and crude oil. Copper is one of the most heavily used metals in manufacturing and building construction. Copper prices fell from over $3 a pound in mid-2014 to under $2 a pound during this year’s first quarter. However, since hitting that low, copper has rebounded to around $2.30 a pound (Chart 6). Similarly, crude-oil prices have rebounded sharply in recent weeks, rising from a low in the mid-$20s a barrel to around the mid-$40s at the end of April (Chart 7). Resurgent prices for key materials suggest a more optimistic outlook for manufacturing and construction.
U.S. Equities
Real stock prices—stock prices adjusted for inflation—are a leading indicator in our Business-Cycle Conditions model. Data through March show this measure continues to trend down. On a nominal basis (not inflation-adjusted), data through April show stocks continued to rebound from a mid-February low through a mid-April high before generally stabilizing during the second half of April.
The stocks in the Standard & Poor’s 500 index are categorized in 10 economic sectors. Comparing the relative performance of sectors can provide additional insight beyond the performance of the index overall.
The S&P 500’s consumer-discretionary stocks include auto and auto parts manufacturers; consumer durable goods and apparel manufacturers; and consumer services, such as hotels, leisure and restaurants, media companies, and retailers. These all tend to be cyclical and sensitive to changes in economic conditions. The S&P 500’s consumer-staples stocks include food and drug stores, food and beverage manufacturers, and makers of household and personal-care products. These stocks tend to be less sensitive to changing economic conditions.
Comparing the relative performance of consumer-discretionary and consumer- staples stocks can provide insight into the current economic outlook. Early last year, as the U.S. economy weakened, consumer-discretionary stocks underperformed – hitting a low relative to consumer-staples shares during the period. As expectations for an economic rebound rose, consumer-discretionary stocks began to outperform shares of consumer-staples providers. This can be seen in Chart 8, where the line hit a low in early 2015, then trended higher.
A similar pattern occurred in late 2015 as consumer-discretionary stocks underperformed staples shares ahead of this year’s weak first-quarter GDP growth (Chart 8). But since mid-February, consumer-discretionary stocks have mostly outperformed consumer staples, suggesting investors are anticipating improved economic activity.
Global Equities
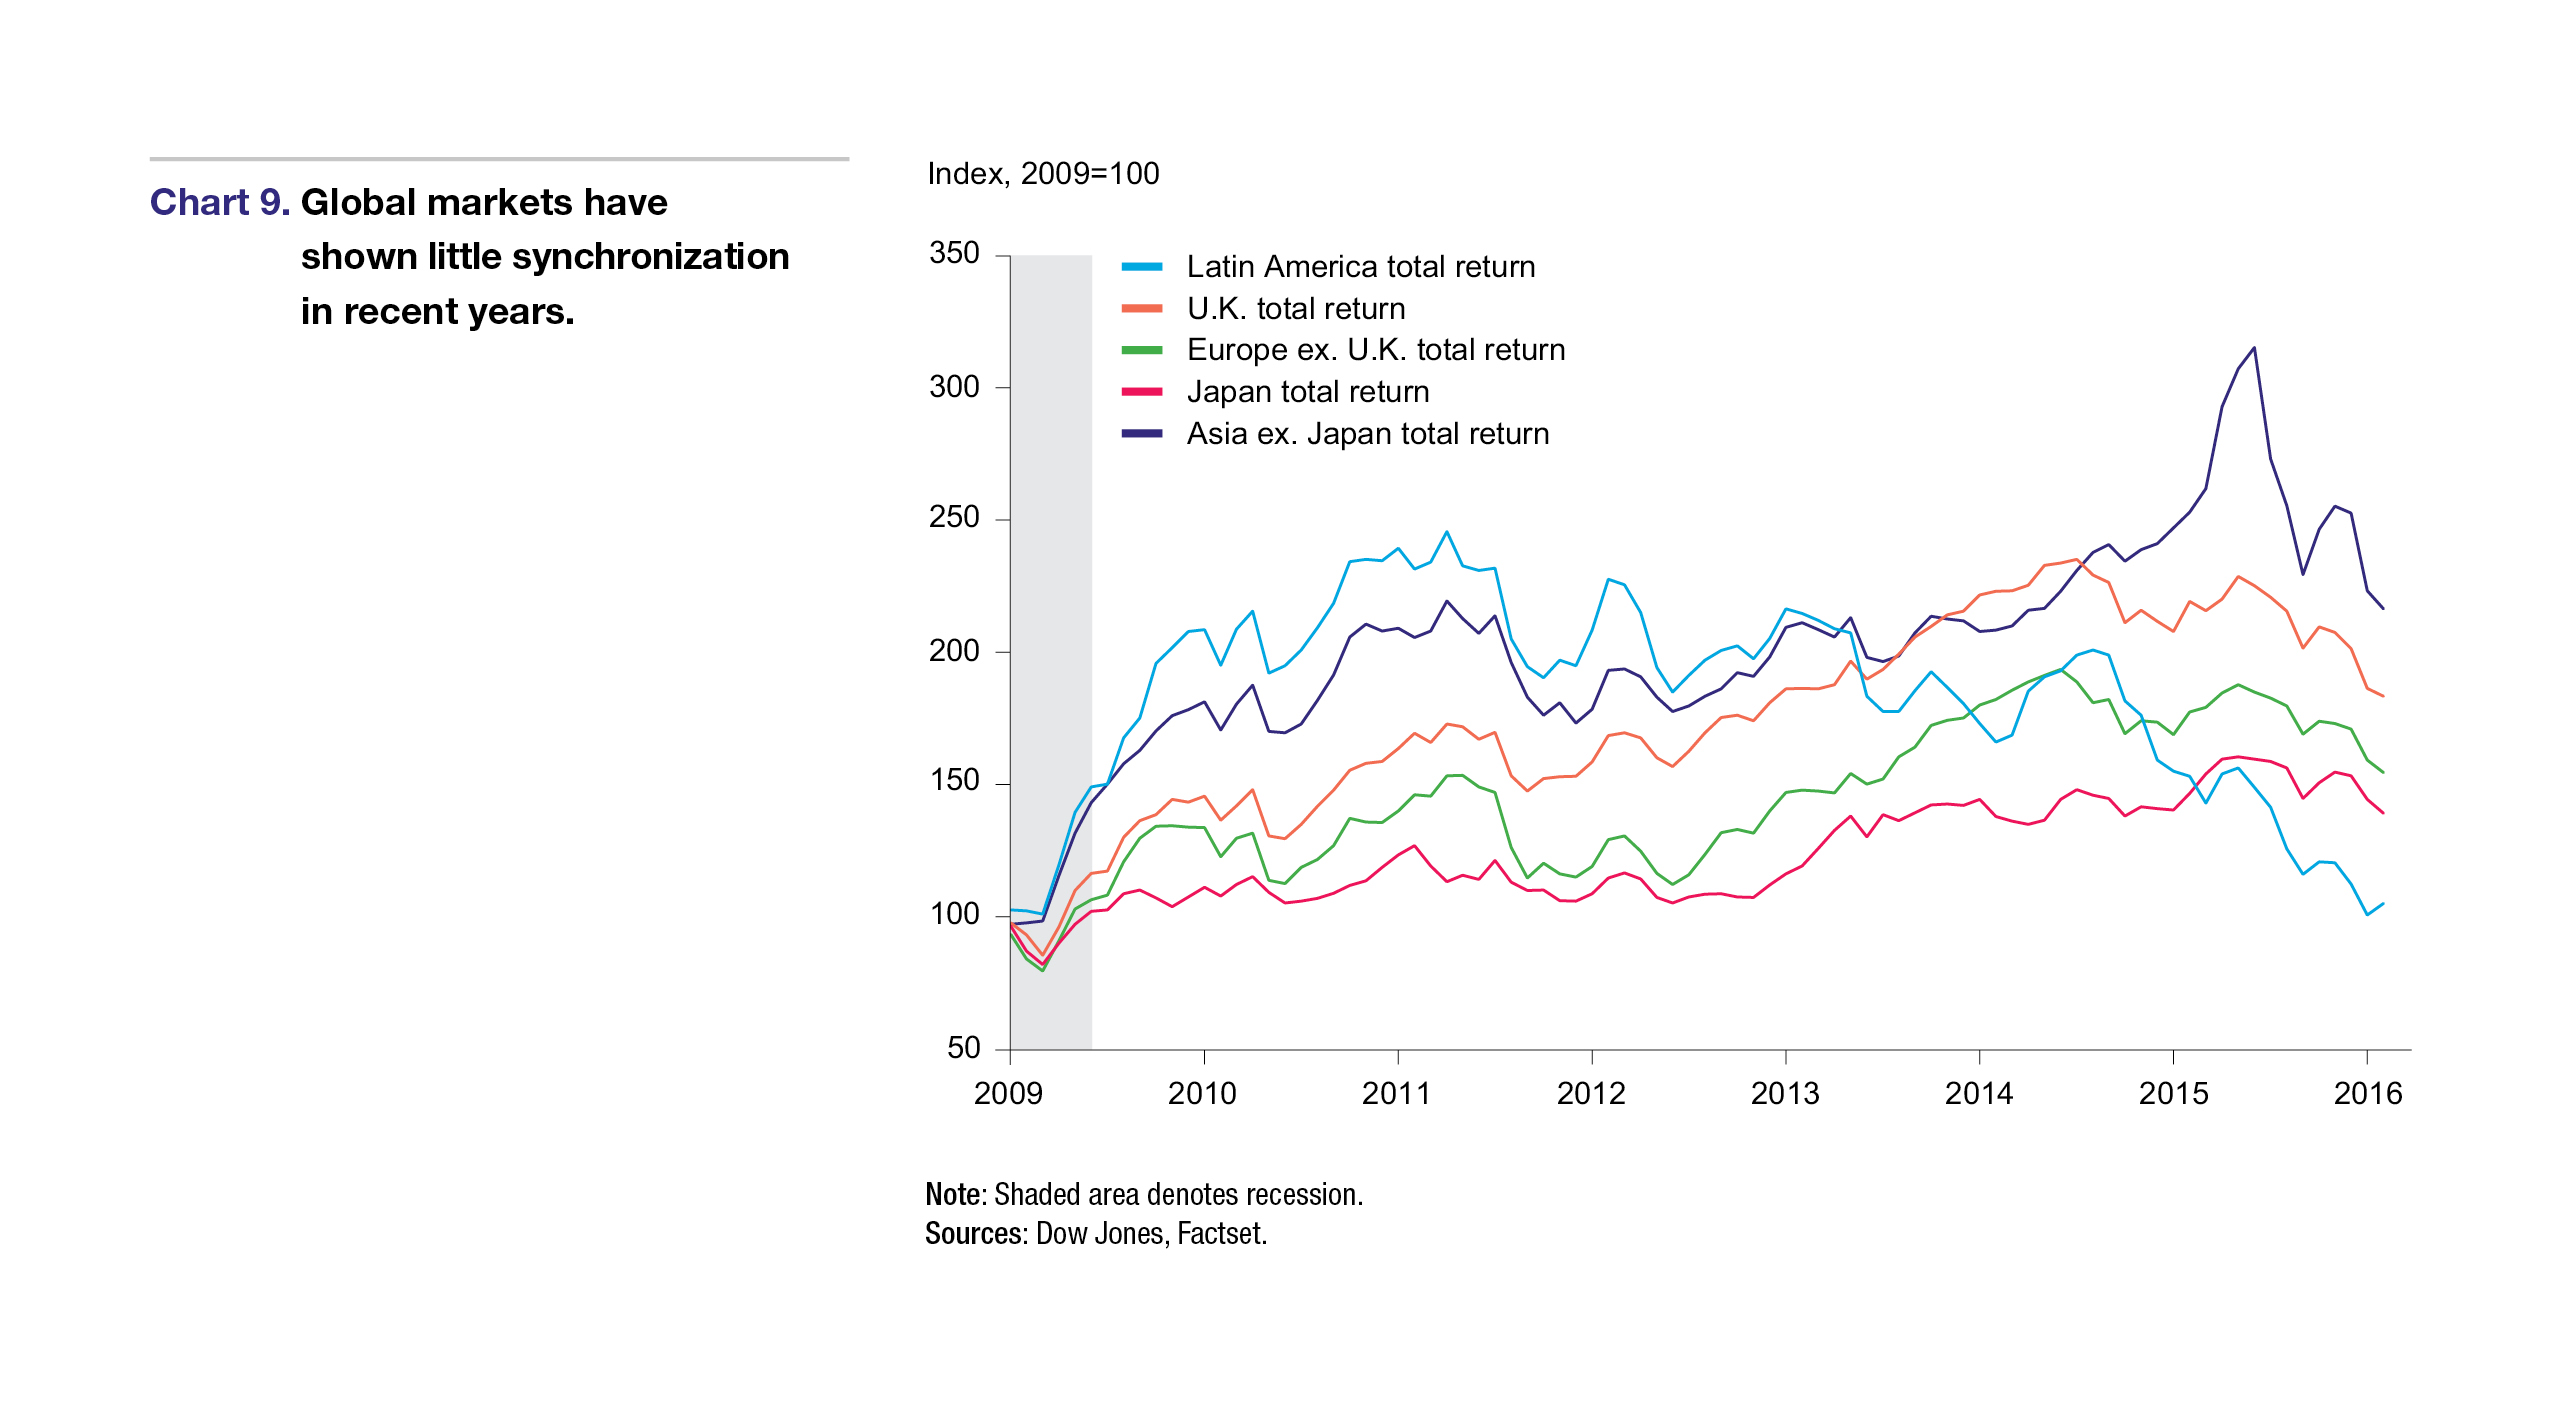
In the U.S., recent weak economic data has suggested an elevated risk of recession, though we still have not concluded that a recession is probable in the next six to 12 months. A downturn, should it occur, would be the fourth U.S. recession in the past three decades. In Japan, the past three decades have been much tougher. The Japanese economy has already logged seven recessions since 1992 (Chart 9). Over that time, Japanese equities have trended flat to down. In fact, since hitting an all-time high in 1990, Japanese equities are still more than 30 percent below that peak, more than 25 years later.
There are two important lessons from Japan’s experience. First, the economy matters. Weak economic performance and frequent recessions will weigh on stock performance. Investors should be mindful of economic conditions and adjust their investment allocations accordingly. That has been the philosophy of AIER since its founding in 1932, and it holds for investments in both the U.S. equity markets and those abroad.
The second important lesson is that equities don’t always go up—past performance is not a guarantee of future results, as is often said. This is particularly important to remember when determining asset allocations. It’s too easy to put a set of expected returns and estimates for volatility into an asset allocation model and get a false sense of security. The reality is that the future is unknown. Investing should be an ongoing process, not a once-and-done event. Any investor in Japanese equities who expected the same returns for the 25 years after 1990 based on the previous 25 years prior would be extremely disappointed.
Next/Previous Section:
1.Overview
2. Economy
3. Inflation
4. Policy
5. Investing
6. Pulling It All Together/Appendix