March Business Conditions Monthly

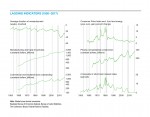
AIER’s Business Cycle Conditions Leading Indicators index held steady at 42 in February while the Roughly Coincident Indicators index and the Lagging Indicators index were also unchanged, at 92 and 75, respectively (see chart). Despite having the Leading Indicators index below 50 for a second consecutive month, the outlook remains moderately positive, though with a heightened degree of caution.
The recent government shutdown has resulted in delays in publishing many economic data series. Though the flow of data is improving, many economic reports are still delayed. Those delays make gauging current economic conditions more difficult. Data from private sources suggest the economy is still relatively healthy and that some previous signs of weakness may be reversing.
Limited economic data combined with a high degree of uncertainty in trade policy and global economic conditions warrant a cautious view, but continued economic expansion remains the most likely path.
Leading indicators remain below 50 for a second month in February
Note: The recent government shutdown included the Department of Commerce, the source of some of the AIER business cycle indicators. For the February update, 5 of the 12 leading indicators remain behind schedule. Caution should be exercised when interpreting the performance of the index.
The AIER Leading Indicators index held at 42 in February. The steady reading followed four consecutive declines from October 2018 through January 2019. January and February mark the first back-to-back results below 50 since July and August 2016. The index last fell below 50 in March 2016 and remained at or below 50 for five months from March through August. The performance of the indicators was consistent with a broad economic slowdown, but no recession developed.
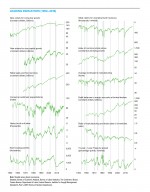
Among the 12 leading indicators, 4 showed a positive trend in February, with 6 trending lower and 2 indicators neutral, the same mix as in January. However, four indicators had offsetting changes for the month. The manufacturing-and-trade sales-to-inventories ratio weakened from neutral to a downtrend while real new orders for core capital goods weakened from a positive trend to neutral. Offsetting those were an improvement from a downtrend to neutral in housing permits and an improvement from neutral to a positive trend for real new orders for consumer goods.
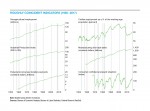
The Roughly Coincident Indicators index held at 92 in February. This index has oscillated between 92 and 100 since March 2017, hitting 92 in 7 of those months and scoring perfect 100s in 17. There were no changes to the trends for the six roughly coincident indicators, with five indicators showing positive trends, one, The Conference Board’s present-situation consumer-confidence index, maintaining a neutral trend, and none in a downward trend.
AIER’s Lagging Indicators index also remained unchanged in the latest month, posting a reading of 75 in February. Among the six lagging indicators, four indicators are trending higher, one, real private nonresidential construction expenditures, is trending lower, and one, the 12-month percent change in the core consumer price index, is neutral. Those results match the January results.
Overall, the three AIER business cycle–indicator indexes held steady in February, though some data remain delayed. Vigilance is warranted given the high level of uncertainty regarding trade policy and weakening global economic conditions; however, some recent U.S. data from private sources suggest economic activity may be recovering from the recent soft patch.
Growth in real gross domestic product slowed in the fourth quarter
Real gross domestic product rose at a 2.6 percent annualized rate in the fourth quarter, down from a 3.4 percent pace in the third quarter. For calendar year 2018, real gross domestic product grew 2.9 percent, the highest since 2015. Growth in the fourth quarter was driven primarily by solid gains in real consumer spending and real business investment.
Real consumer spending decelerated in the fourth quarter, rising at a 2.8 percent pace following robust gains of 3.5 percent and 3.8 percent in the third and second quarters, respectively. The deceleration was concentrated in real nondurable-goods spending, up 2.8 percent versus 4.6 percent in the third quarter, and real services spending, gaining 2.4 percent versus 3.2 percent previously. Real durable-goods spending rose 5.9 percent versus 3.7 percent in the prior quarter. Real consumer spending contributed 1.9 percentage points of the 2.6 percent growth in real gross domestic product.
Real business fixed investment rose at a 6.2 percent annualized rate in the fourth quarter, more than double the 2.5 percent pace of the third quarter. At annualized rates, the gain was led by a 13.1 percent jump in real intellectual property investment while real investment in equipment rose 6.7 percent. Real investment spending on structures fell 4.2 percent following a 3.4 percent fall in the third quarter and two quarters of double-digit growth in the first half of 2018. Real business investment contributed 0.82 percentage points to overall growth in real gross domestic product versus a 0.35-percentage-point contribution in the third quarter.
Real residential investment, or housing, fell at a 3.5 percent pace in the fourth quarter compared to a 3.6 percent decline in the prior quarter. Real spending on housing has declined in six of the past seven quarters and continues to face a challenging environment, with rising interest rates and elevated home prices dragging down affordability.
Real inventory accumulation by businesses continued in the fourth quarter, adding 0.13 percentage points to fourth-quarter growth after adding 2.33 percentage points in the prior quarter. Real exports rose at a 1.6 percent pace while real imports grew at a 2.7 percent rate.
Real government spending rose at a 0.4 percent annualized rate in the fourth quarter compared to a 2.6 percent increase in the third quarter, contributing 0.07 percentage points to growth versus a 0.44 percentage-point contribution in the prior quarter. Exploding federal deficits remain one of the most significant risks to the medium- and long-term outlook for the economy.
Real final sales to private domestic purchasers, a key measure of private domestic demand, rose at a very healthy 3.1 percent annualized rate in the fourth quarter, up slightly from a 3.0 percent pace in the third quarter. The fourth-quarter gain was the sixth time in the past eight quarters that growth met or exceeded 3 percent.
Despite the distortions from the government shutdown and elevated uncertainty surrounding trade policy and global economic conditions, the underlying trend in real private domestic demand remains well-supported by continued job creation, rising wages, healthy corporate and consumer balance sheets, solid corporate-sales and corporate-earnings growth, and reasonably high levels of business and consumer confidence.
Consumer price increases remain modest
The personal-consumption-expenditures price index rose at a 1.5 percent pace in the fourth quarter, slower than the 1.6 percent pace in the third quarter. The quarter-to-quarter rate of increase in the index has decelerated for four consecutive quarters. Measured from fourth quarter of 2017 to fourth quarter of 2018, the increase is 1.9 percent. Over the past 20 years, the annualized rate of increase in the index is 1.8 percent.
For core consumer prices, which exclude volatile food and energy components, the index rose 1.7 percent, up from 1.6 percent in the prior quarter. Over the last four quarters, core consumer prices rose 1.9 percent. Over the past 20 years, the annualized rate of increase in the core personal-consumption price index is 1.7 percent. Core consumer-price increases have stabilized at just under 2 percent and appear unlikely to accelerate dramatically in the quarters ahead.
Purchasing managers’ reports show continued expansion
The Institute for Supply Management’s surveys of purchasing managers in the manufacturing sector and nonmanufacturing sector are two of the most highly regarded private sources of economic data. The combination of breadth, timeliness, and long history (especially for the manufacturing survey) make the surveys valuable sources of information, especially during and immediately following the government shutdown.
The nonmanufacturing composite index rose to a reading of 59.7 from 56.7 in January. Fifty is neutral for these indexes. Typically, the nonmanufacturing index ranges between 50 and 60, with dips below 50 during recessions. The February result ranks near the high end of the typical range.
All of the key components of the nonmanufacturing index were above 50 in February. The business-activity index was 64.7 in February, up from 59.7 in January. For February, 16 industries in the nonmanufacturing survey reported growth while just 1 reported contraction. The nonmanufacturing new-orders index came in at 65.2, a very strong result. The nonmanufacturing employment index decreased to 55.2 in February, versus 57.8 in January. Supplier deliveries, a measure of delivery times for suppliers to non-manufacturers, came in at 53.5, up from 51.5 in January, suggesting suppliers are falling farther behind in delivering supplies to non-manufacturers.
The Manufacturing Purchasing Managers’ Index registered a 54.2 percent reading in February, down from 56.6 in January. Despite the pullback, the index remains above neutral, suggesting continued expansion for the manufacturing sector.
All of the key components of the Purchasing Managers’ Index were also above 50 in February. The New Orders Index came in at 55.5 percent, down from 58.2 in January. The production index was at 54.8 percent in February, down from 60.5 in January. The slower pace of expansion contributed to an increase in the backlog-of-orders index. That index rose to 52.3 in February versus 50.3 in January, suggesting backlogs grew at a faster pace. The employment index fell to 52.3 percent in February, down from 55.5 in January. Supplier deliveries came in at 54.9, down from 56.2 in January.
Customer inventories in February are still considered too low, with the index falling to 39.0 from 42.8 in the prior month (index results below 50 indicate customers’ inventories are too low and suggest strong future demand).
