May Business Conditions Monthly

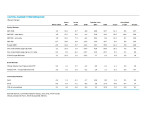
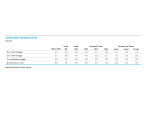
AIER’s Leading Indicators index rose 13 points to 38 in April, up from 25 in March. March’s result was the lowest since June 2009. The Roughly Coincident Indicators index and the Lagging Indicators index both held steady, at 83 and 67, respectively (see chart). April is the fourth consecutive month with readings for the Leading Indicators index below the neutral 50 threshold but is the first month since September 2018 to show improvement. The duration and severity of the declines in recent months justify concern regarding the durability of the economic expansion, but the improvement in April is a favorable development.
The first estimate for first-quarter growth in real gross domestic product was deceptively positive. While headline growth was 3.2 percent, the underlying details were much less favorable. The causes of the weakness in the details vary widely. Some sectors face enduring pressures while others appear to be weighed down by temporary forces. Overall, caution is still warranted but the likely path is continued growth as the economy approaches the record for longest economic expansion.
Leading indicators rebound in April
Note: The government shutdown in December and January included the Department of Commerce, the source of some of the AIER business cycle indicators. During the first three months of 2019, several indicators were delayed or behind their normal update schedule. For the April update, all 24 indicators were back on the normal update schedule.
The AIER Leading Indicators index rose to 38 in April. The reading is the fourth month in a row below the neutral 50 threshold, but it is the first improvement in the index since September 2018 and marks an important reversal in momentum.
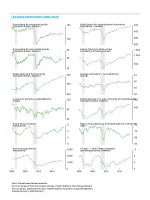
Half of the 12 leading indicators were trending lower in April, fewer than the 8 decliners in March. The remaining 6 indicators were evenly split with 3 rising and 3 neutral.
Four indicators changed direction in April with three improving and one worsening. Initial claims for unemployment insurance was the strongest riser, changing from a downtrend last month to an uptrend in April. Real new orders for consumer goods moved to a neutral trend in March but returned to a positive trend in April. Real stock prices was the third indicator to show improvement, moving from a negative trend in March to a neutral trend in April. Nominal stock prices are close to record highs in early May, suggesting the real-stock-price indicator may move back to a positive trend in coming months. The one indicator to weaken in the latest update was heavy-truck unit sales, falling from a positive trend to a neutral trend.
The Roughly Coincident Indicators index and the Lagging Indicators index were unchanged in April, and none of the individual indicators in either index changed direction.
The severity of the decline in the Leading Indicators index in recent months justifies concern regarding the durability of the economic expansion. The improvement in April’s Leading Indicators index is an important development, providing some evidence that economic activity may be on the upswing. Solid readings from the Roughly Coincident Indicators index combined with the improvement in the Leading Indicators index and a tilt toward positive results in other economic data suggests a cautious but positive outlook.
The current expansion is approaching the record for duration. The current record is 120 months, from March 1991 (trough month) through March 2001 (peak month). The current expansion began in July 2009 (the trough month was June 2009), so the current expansion will tie the record in June 2019 and break the record in July 2019 if the expansion continues, which is highly probable at this point.
First-quarter growth in real gross domestic product was deceptive
Real gross domestic product rose at a 3.2 percent annualized rate in the first quarter, up from a 2.2 percent pace in the fourth quarter of 2018. Over the past four quarters, real gross domestic product is up 3.2 percent, the fastest pace since 2015.
Despite the strong headline growth rate, many components of domestic demand were weak, but they were offset by substantial inventory accumulation and lower imports (imports count as a negative in the calculation of GDP). Weakness in domestic demand in the first quarter was expected as the government shutdown in December and January affected economic activity.
Real final sales to private domestic purchasers, a key measure of private domestic demand, rose at a lethargic 1.3 percent annualized rate in the first quarter, down from a 2.6 percent pace in the fourth quarter. The first-quarter gain was the slowest since 2013. Over the past four quarters, real private domestic demand is still up at a 2.8 percent rate, slightly below the 3.0 percent gain for the fourth quarter of 2018.
Boosting weak domestic demand was inventory accumulation by businesses, which accelerated in the first quarter, adding 0.65 percentage points to first-quarter growth after contributing 0.11 percentage points in the prior quarter. Inventory accumulation has boosted growth in real gross domestic product for three consecutive quarters. These contributions will likely be reversed in coming quarters.
Exports rose at a relatively robust 3.7 percent pace, adding 0.45 percentage points, while imports declined at a 3.7 percent rate, adding 0.58 percentage points in the calculation of gross domestic product. Since imports count as a negative in the calculation of gross domestic product, a drop in imports is a positive for GDP growth.
Together, inventory accumulation and declining imports contributed just over 1 percent in the calculation of the 3.2 percent growth in gross domestic product.
Within domestic demand, consumer spending slowed
Consumer spending decelerated sharply in the first quarter, rising at a sluggish 1.2 percent pace compared to a 2.5 percent growth rate in the fourth quarter. The deceleration was mostly the result of a drop in spending on goods, with durable-goods growth declining from a 3.6 percent pace in the fourth quarter to a 5.3 percent rate of decline in the first quarter. Nondurable-goods spending rose at a 1.7 percent pace versus a 2.1 percent rate in the previous quarter. Spending on services slowed slightly, from 2.4 percent to 2.0 percent.
Real retail sales, one of the AIER leading indicators, remained in a downtrend through April. However, as mentioned above, real new orders for consumer goods returned to a positive trend in the latest update, a favorable sign.
Nominal retail sales have been erratic recently, posting four declines over the past eight months. March retail sales jumped 1.6 percent following a 0.2 percent decline in February and a 0.8 percent gain in January. Over the past year, they are up 3.6 percent. Core retail sales, which excludes motor vehicles and gasoline, rose 0.9 percent in March following a 0.7 percent decline in February. From a year ago, core retail sales are up 3.7 percent, slightly below the five-year annualized growth rate of 4.1 percent.
Unit vehicle sales have also been volatile, declining in four of the past eight months. April unit sales fell to a 16.45 million annual rate, down from 17.4 million in March. Over the last eight months, unit sales have averaged 17.1 million, similar to the 17.25 million average since 2015.
Despite the weak first quarter for consumer spending, fundamentals are generally favorable, supported by a tight labor market, rising wages, and solid balance sheets.
Business investment, led by intellectual-property products, rose modestly
Business investment, or real nonresidential fixed investment, rose at a 2.7 percent annualized rate in the first quarter of 2019. That gain was led by an 8.6 percent rise in intellectual-property investment. Spending on equipment rose 0.2 percent versus a 6.6 percent increase in the previous quarter while spending on structures fell 0.8 percent, better than the 3.9 percent drop in the prior quarter. Spending on nonresidential structures has fallen for three consecutive quarters.
Housing remains weak
Residential investment, or housing, fell 2.8 percent in the first quarter compared to a 4.7 percent decline in the prior quarter. Housing investment has decreased for five straight quarters.
Though new construction remains weak, sales of new single-family homes jumped 4.5 percent in March to a 692,000 seasonally adjusted annual rate, the third monthly rise in a row, resulting in a 3.0 percent gain from a year ago. The string of gains in sales appears to have negated the recent downtrend.
Total inventory of new single-family homes for sale dropped 0.3 percent to 344,000 in March, leaving the months’ supply (inventory times 12 divided by the annual selling rate) at 6.0. Total inventory is still 15.8 percent above year-ago levels while the months’ supply is 13.2 percent aof last year. The supply is about 50 percent above the average of about four months from 1998 through 2005.
After rising sharply from late 2017 through late 2018 and contributing to a slowdown in home sales, mortgage rates have declined by almost 50 basis points in early 2019, helping reverse the downtrend in sales.
However, rising home prices remain a drag on housing as prices continue to post gains in the 4 to 5 percent range, though that is a deceleration from the 6.5 to 7.5 percent range in early 2018. Home prices are 12 to 20 percent above the peaks during the housing bubble. While lower mortgage rates are supportive, rising prices are likely to restrain demand for new construction.
Labor productivity posting better gains
U.S. labor productivity (real output per labor-hour) rose at a 2.4 percent rate in the first quarter measured from a year ago. That is the fastest pace since 2010. Weak productivity growth has been a concern among economists for much of the current expansion. Gains in the 2.5 to 5 percent range were common in the mid-1990s through the mid-2000s, but much of the current expansion generally saw gains of less than 2 percent and occasional declines. More recently, productivity has shown a solid improving trend since mid-2016 and is entering a range more consistent with the late 1990s and early 2000s.
The strong gains in labor productivity have helped restrain unit labor costs. Unit labor costs were up just 0.1 percent from a year ago in the first quarter despite increases in wages. Restrained unit labor costs should help reduce cost-push pressures on price levels.
Corporate sales and earnings
As of May 3, about three-fourths of the S&P 500 had reported sales and earnings results for the first quarter. Sales for the S&P 500 were up 5.1 percent versus a year ago, the same pace as the fourth quarter of 2018 but slower than six of the seven prior quarters, but still a respectable pace. Of 11 sectors, 9 had gains while 2 saw revenue declines versus last year.
Earnings per share, however, were up just 0.9 percent for the first quarter, the slowest rise since a 2.1 percent decline in the second quarter of 2016. Earnings per share were up 16.9 percent in the fourth quarter. The energy sector was a major drag on earnings per share in the first quarter, falling 26.2 percent, though there were declines in 6 of the 11 sectors. Despite the weak first-quarter performance, current earnings-per-share estimates show gains over the next 12 months.
[pdf-embedder url=”https://www.aier.org/wp-content/uploads/2019/05/BCM_2019_05_FINAL.pdf“]


