September Business Conditions Monthly


AIER’s Business Cycle Conditions Leading Indicators index rebounded in the latest month, registering an 83 in August. The Roughly Coincident Indicators index held at 100 while the Lagging Indicators index also held steady, posting an 83 (see chart below). With all three indicators well above the neutral 50 level, the AIER business cycle indicators signal continued economic expansion and support a positive outlook with a low probability of recession.
Most measures of economic activity suggest that the economy remains robust. Consumer spending remains well-supported by a tight labor market and high levels of consumer confidence. Business investment in equipment continues at a healthy pace, supported by corporate sales and earnings growth. Housing appears to be one soft area. Lingering concerns are the impact of tariffs and trade policy, federal debt, and typical late-cycle risks of accelerating price increases and excessive debt accumulation. For now, the outlook remains positive, but careful monitoring of potentially destabilizing risks is warranted.
Leading Indicators Rose in August, Reversing a Two-Month Pull Back
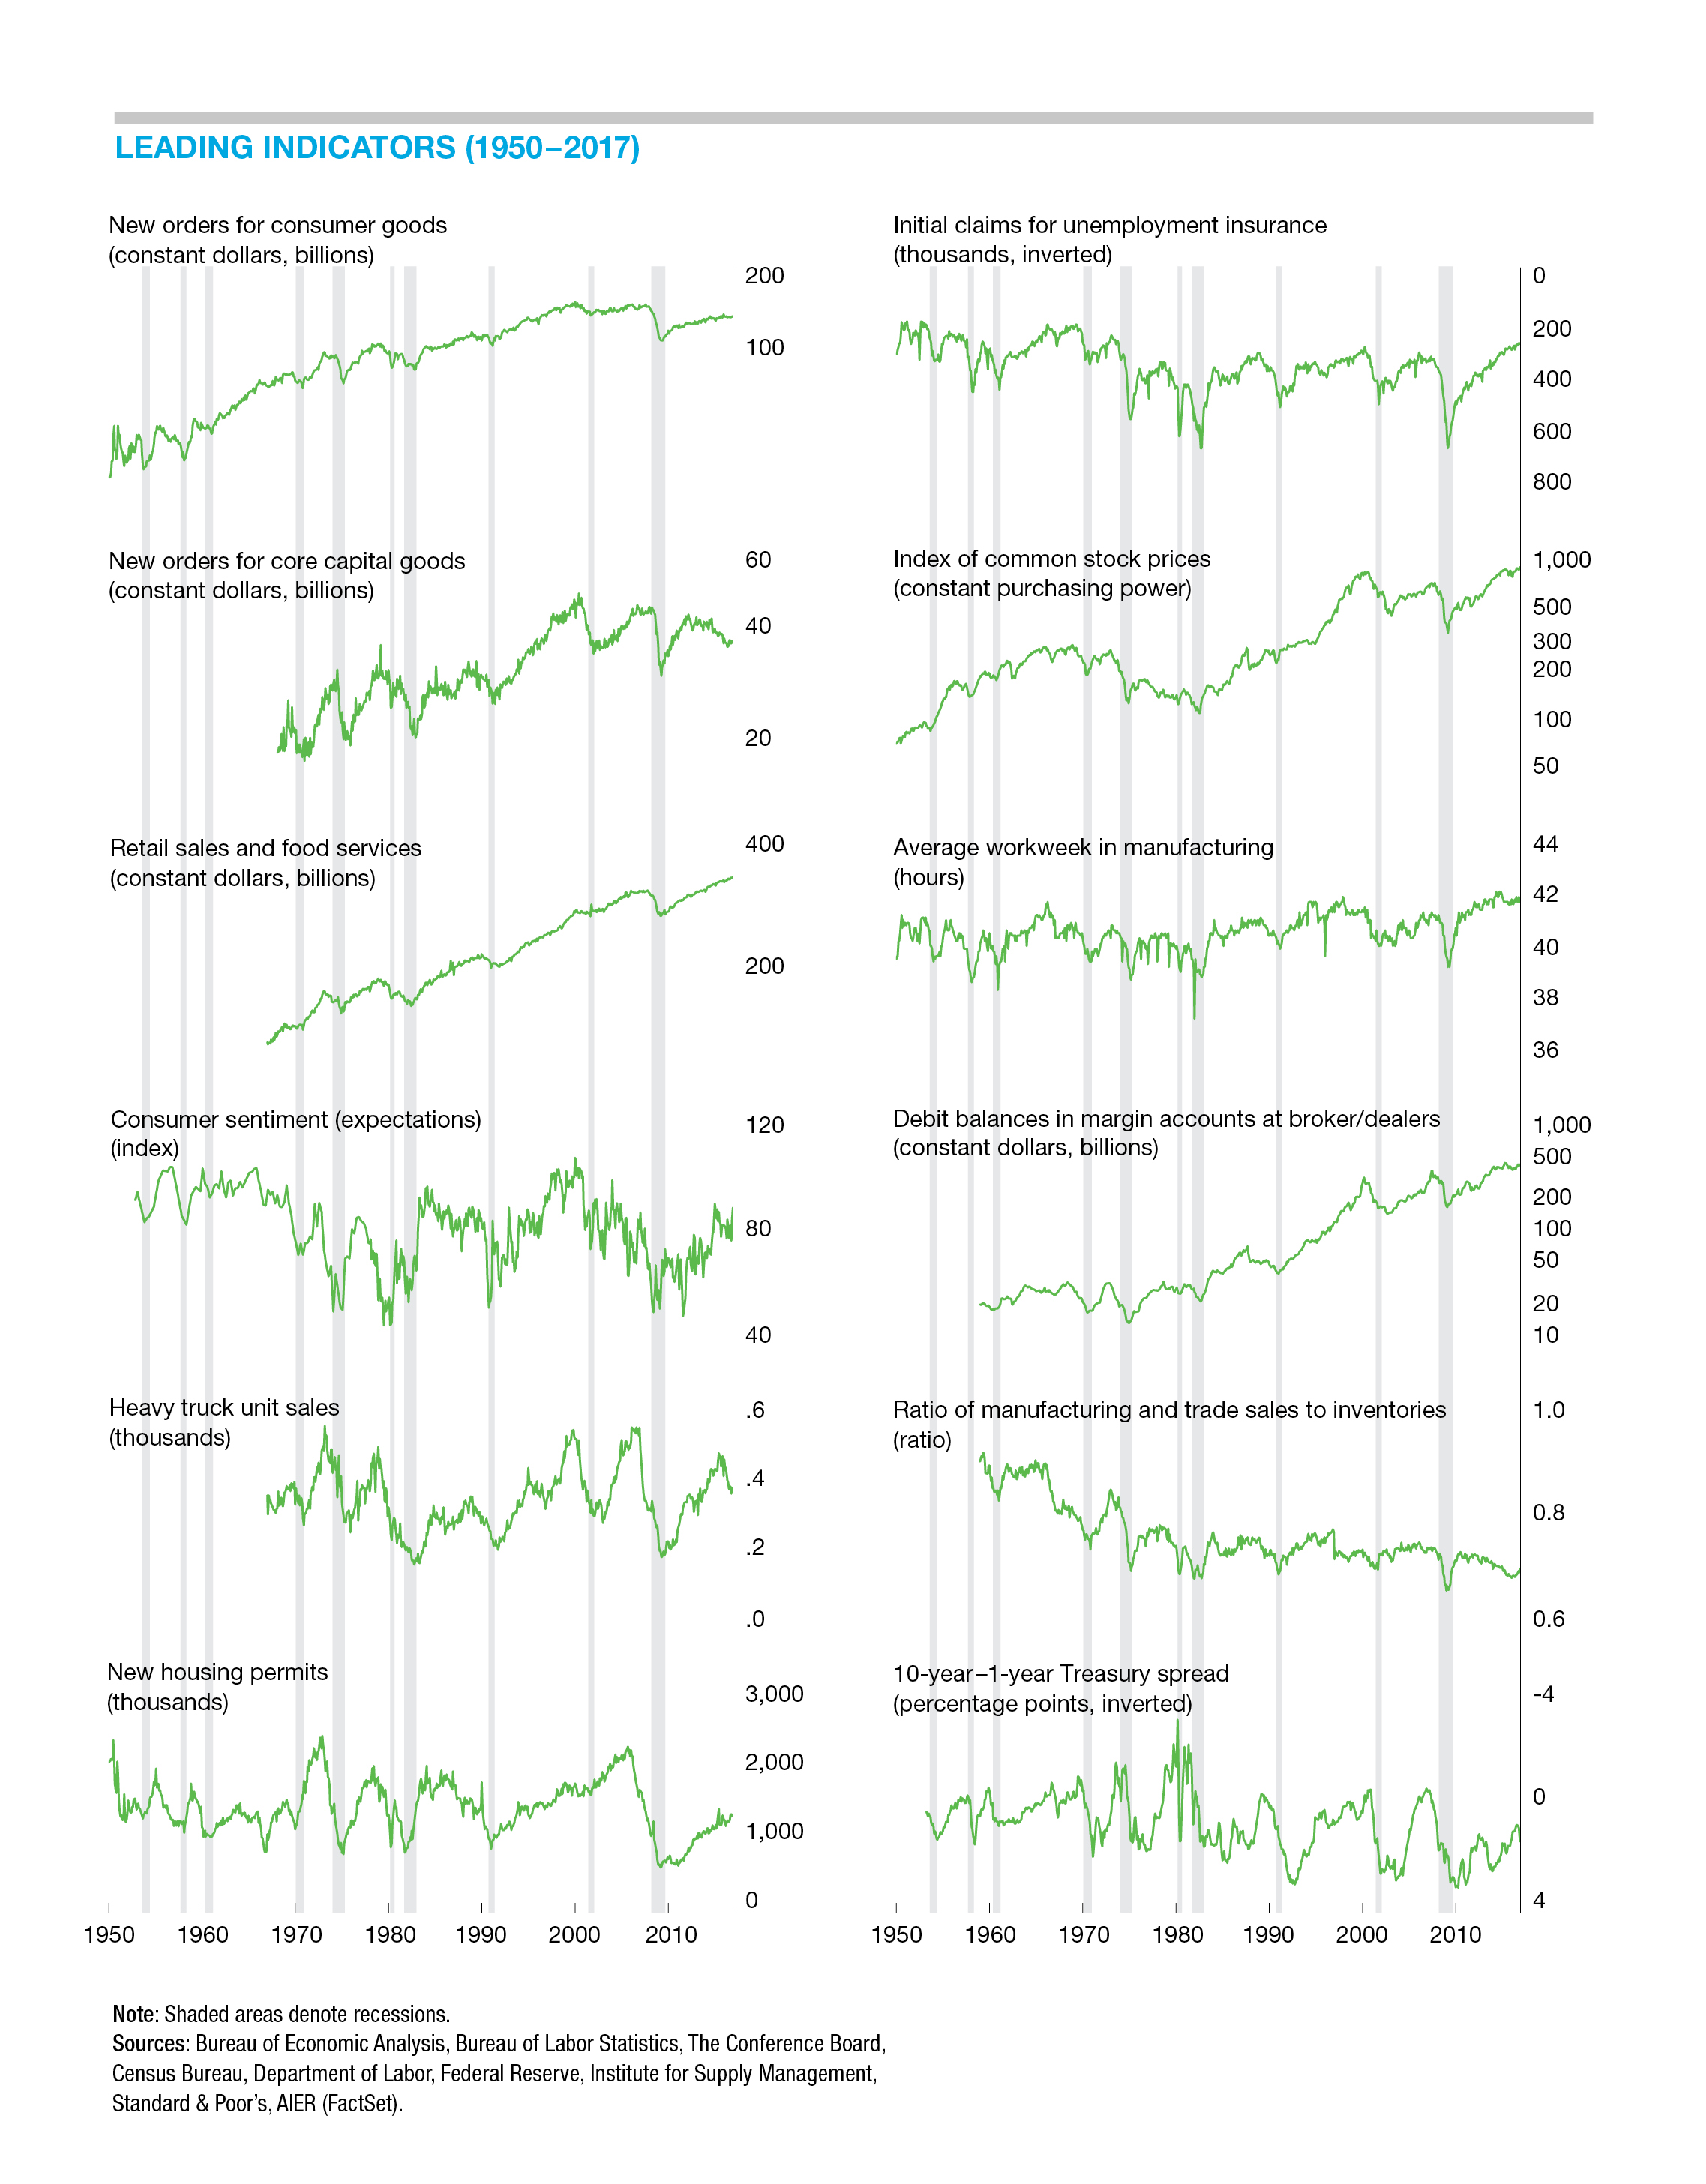
The July update of the AIER Leading Indicators index saw a total of five indicators trending flat, leaving seven indicators trending higher and none in a downward trend. In the latest month, two of the five moved back to positive trends while one turned downward, pushing the index slightly higher to a reading of 83 versus 79 in July. August was the first month since February in which a leading indicator was trending lower.
Housing permits weakened to a downtrend in August after turning downward to a neutral trend in June. As discussed last month, the housing market may be struggling with a combination of rising home prices and rising interest rates. While affordability overall remains favorable, it has become significantly less favorable over the past few years.
Offsetting the weaker trend from housing permits, real stock prices and real new orders for consumer goods both turned from a neutral trend to a positive trend in August. Both reflect solid fundamentals. Consumers are benefiting from a strong labor market and slowly accelerating growth in income as well as increases in net worth. Real stock prices are benefiting from gains in sales and earnings as well as ongoing stock buybacks, partially driven by strong corporate cash flow.
The Roughly Coincident Indicators index held at a perfect 100 in August. The index has hit perfect 100s in 14 of the past 18 months, with the most recent dip below 100 occurring in June. The strong performance of the index is consistent with the majority of economic data, from both public and private sources, that suggest the economy is performing well more than nine years into the current expansion.
AIER’s Lagging Indicators index also held steady in the latest month, posting a reading of 83 in August following three months at 92 from April through June. Overall, four indicators are trending higher, none are trending lower, and two are neutral. Real manufacturing and trade inventories as well as real nonresidential construction were neutral indicators in the latest month.
The three AIER business cycle indicator indexes are well into favorable territory, suggesting a continued positive economic outlook with a low probability of recession in the coming months.
Retail Sales Start Third Quarter Off On a Positive Note
Real consumer spending grew at a 3.8 percent pace in the second quarter following a dismal 0.5 percent increase in the first quarter. That gain contributed 2.55 percentage points to the 4.2 percent real GDP growth for the quarter. Durable goods, nondurable goods, and services all posted solid growth. In nominal terms, consumer spending rose 5.7 percent in the second quarter. Over that same period, nominal retail sales posted an annualized growth rate of 7.3 percent.
In July, the first month of the third quarter, retail sales rose 0.5 percent. The July gain in retail sales was led by strong increases in clothing stores (1.3 percent), restaurants (1.3 percent), non-store retailers (0.8 percent), gasoline stations (0.8 percent), general-merchandise stores (0.7 percent), and grocery stores (0.6 percent). Electronics stores’ sales rose a modest 0.1 percent.
Motor vehicles and parts dealers saw sales rise 0.2 percent for the month as auto sales came in at a 16.77 million-unit annual rate. Auto sales for August have already been tabulated; sales were about the same as in July, coming in at a 16.72 million-unit annual rate. The latest data continue to show a trend away from cars and toward light trucks. In August, light trucks (pickups and SUVs) accounted for 69.3 percent of all light vehicles, with domestic production totaling 56.0 percent and imports taking 13.3 percent. Domestic production of cars totaled 22.5 percent of light vehicles while car imports made up 8.2 percent.
The weakest categories of retail sales in July were sporting-goods, hobby, and book stores (−1.7 percent), furniture and home-furnishings stores (−0.5 percent), health and personal-care stores (−0.4 percent), and miscellaneous store retailers (−0.3 percent). Building-materials and garden-equipment store sales were unchanged for July versus June.
Over the past year, retail sales have increased in almost every category. Only one category—sporting-goods, book, hobby, and music stores—has declined in sales over the past year, having dropped 4.9 percent.
Manufacturing Outlook Remains Positive
Industrial production is up 4.2 percent over the 12 months through July. Within total industrial production, manufacturing accounts for about three-quarters of the total output. Manufacturing production has increased 2.8 percent through July, led by a 4.5 percent increase in durable goods. Within durable goods, motor vehicles were up 8.8 percent, computers and electronics were up 8.5 percent, and fabricated metals, wood products, and nonmetallic mineral products were each up 5 percent or more. Aerospace-equipment, furniture-products, and miscellaneous-products production each declined over the past year. Nondurable-goods production increased 1.4 percent over the year, led by a 2.3 percent rise in chemicals production. That increase was partially offset by declines in paper products as well as printing and support products.
Data from the Census Bureau within the Department of Commerce show orders for future manufacturing production fell 0.8 percent in July, pulled down by sharp drops in orders for defense and nondefense aircraft. Excluding all transportation equipment, orders for manufactured goods rose 0.2 percent for July.
Data from the Institute for Supply Management suggest orders for future manufacturing picked up a bit more in August. The new-orders index from the ISM Manufacturing Report on Business increased to 65.1 in August, the 16th month above 60 and the 32nd month above the neutral 50 level. Together, the data from the Department of Commerce and the ISM on new orders suggest a positive outlook for manufacturing in the months ahead.
Corporate Sales and Earnings
Second-quarter corporate profits reported in the GDP release from the Bureau of Economic Analysis showed corporate profits after tax on a NIPA (national income and product accounts) basis rose 2.4 percent in the second quarter following an 8.2 percent rise in the first quarter. From a year ago, profits are up a robust 16.1 percent. Removing inventory-valuation adjustments and capital-consumption adjustments made in accordance with NIPA accounting methods, bringing the figure closer to private sector accounting standards, after-tax profits rose 3.7 percent in the second quarter following an 8.5 percent gain in the first quarter. After-tax profits on this basis totaled $1,968.5 billion at an annual rate, a new record.
For the S&P 500, as of September 7, second-quarter revenues are up 9.5 percent from a year ago, according to Thomson Reuters. The energy, materials, technology, and real estate sectors all posted double-digit growth. With 497 of the 500 reporting, 72 percent beat expectations while 28 percent fell short. Bottom-line earnings posted a 24.8 percent gain relative to the second quarter of 2017, led by a 122 percent jump in the energy sector. Eighty percent of companies beat expectations for bottom-line earnings.
After-tax profits are benefiting from strong economic growth and from recent cuts to corporate tax rates. Solid corporate-profit growth helps support future hiring and investment as well as supporting stock prices.
Stock Buyback and Corporate Debt Issuance
Strong sales and profit growth can influence stock buybacks. If strong profits and cash flow result in the accumulation of capital in excess of investment needs, companies may return capital to shareholders.
Goldman Sachs recently estimated that companies in the S&P 500 will authorize $1 trillion in stock buybacks in 2018, up 46 percent from a year ago and a new record high. While those numbers are substantial, there are other factors to consider. Two important figures are the high level of stock prices, which makes the dollar figure larger, and the amount of new issuance taking place. Because prices rise over time, calculating net issuance (new issuance minus buybacks) as a share of market cap outstanding provides a better analysis. For the first quarter of 2018, nonfinancial corporate businesses issued net equity of −$386 billion at an annual rate. The total market cap of nonfinancial corporate equity outstanding as of the end of 2017 was $26.87 trillion, making net issuance in the first quarter −1.4 percent of market cap. While that is a sizable percentage, it is significantly below the 13-year average of −2.4 percent and well below the −7.8 percent peak in 1988. If businesses are generating cash in excess of investment needs, prudent policy is for that capital to be returned to shareholders, who might then redeploy it to more productive investments.
Companies may also buy back their stock to optimize capital structure. In a low interest rate environment, substituting debt for equity may be beneficial. While nonfinancial corporations had net issuance of −$1.9 trillion of equity over the last four years, debt issuance has increased by $1.33 trillion while new loans have increased by $524.9 billion, for a total of about $1.85 trillion.
Locking in low interest rates for long periods can indicate prudent financial management. The risk is that servicing the debt becomes onerous during an economic slowdown or recession. What may be prudent capital-structure management today might be a problem in the future. At some point, investors might see strong balance sheets as a desirable and differentiating characteristic, but for now debt issuance and stock buybacks are popular.
[pdf-embedder url=”https://www.aier.org/wp-content/uploads/2018/09/BCM_September_2018.pdf“]Robert Hughes

Robert Hughes joined AIER in 2013 following more than 25 years in economic and financial markets research on Wall Street. Bob was formerly the head of Global Equity Strategy for Brown Brothers Harriman, where he developed equity investment strategy combining top-down macro analysis with bottom-up fundamentals. Prior to BBH, Bob was a Senior Equity Strategist for State Street Global Markets, Senior Economic Strategist with Prudential Equity Group and Senior Economist and Financial Markets Analyst for Citicorp Investment Services. Bob has a MA in economics from Fordham University and a BS in business from Lehigh University.


