Spending Habits Shape Inflation
So far 2014 has seen inflation rise each month. Many will see inflation awakening from its previous dormancy as an encouraging sign for the economy. It indicates that lending and spending have increased. On the other hand, those who live on fixed incomes may feel the rising price pressures more acutely. AIER’s Everyday Price Index (EPI) has repeatedly shown that everyday prices—especially gas, medicine, and child care—have risen faster over the last decade than headline inflation numbers suggest.
The EPI measures price changes for frequently purchased goods and services. EPI data exclude infrequently purchased items and payments that tend to be contractually fixed. Excluded items include cars, appliances, computers, apparel, and shelter. The EPI increased 0.5 percent in May and has increased 2.5 percent in the last year, outpacing the CPI.
The EPI offers a unique spending pattern as compared with the CPI, but it does not represent the individual spending patterns of everyone. This report goes beyond the EPI to examine three subgroup spending patterns.
The purchasing patterns analyzed in this report include:[1]
CPI
All spending categories;
EPI Represents everyday prices
for all Americans;
Urban Renter Represents a city dweller, renting an apartment, without a car;
Mr. & Mrs. Wise Represents an older couple with additional medical needs; and
Educated Family Represents a middle-aged couple that is saving and spending on day care and college.
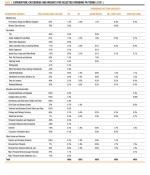
Inflation is distinctive for each of these hypothetical spenders. The Urban Renter has actually seen lower inflation than the headline number. The Educated Family, however, has seen significantly higher inflation than the CPI and the EPI. Table 1 and Chart 1 display inflation for these sample purchasing patterns. A detailed discussion of the key drivers of inflation follows.
EPI Profile
The Bureau of Labor Statistics applies quality adjustments on certain components of the CPI. These adjustments seek to remove any price differences attributed to a change in quality. A more expensive computer with more memory may not be counted as inflation. This helps create part of the difference between EPI and CPI measures since most of the items in the EPI do not receive quality adjustments.
As a result of the adjustments, items such as cars, TVs, and computers have shown zero or negative inflation over the last two decades. The index for new and used cars is nearly unchanged since January 2000, while the index for personal computers and equipment has declined 90 percent. The price index for TVs has decreased 92 percent on a quality-adjusted basis. This makes sense since the quality of computers and TVs has increased rapidly while price changes have been minimal or negative.
Gasoline, however, receives no quality adjustment. BLS considers the quality of gasoline the same today as it was in 2000. The price of gas has increased 183 percent since January 2000, driving the EPI higher.
With big ticket items such as housing, cars, appliances, and electronics excluded, the remaining EPI components receive a heftier weight than they do as part of the CPI. For example, the EPI weight on gasoline is 14.1 percent. This compares with a CPI weight on gasoline of only 5.6 percent and is representative of the everyday prices that consumers regularly encounter.
Utilities, gas, prescription drugs, car insurance, cable TV, tobacco, and child care prices all act to buoy everyday prices as measured by the EPI. Because it excludes items that have seen lower than average inflation and overweights items that have seen higher than average inflation, the EPI has outpaced the CPI since 2000.
Urban Renter
The Urban Renter, a city dweller without a car or children, has experienced lower inflation than the CPI and significantly lower inflation than the EPI.
This profile starts with the EPI profile and excludes child care, motor fuel, car insurance and certain utilities. (See the table on pages 4 – 5 for spending pattern weights). The profile adds shelter (rent), airfare, TVs, audio equipment, pets, and sporting goods. The Urban Renter index overweights food at a restaurant, alcohol, and public transportation.
The result is an inflation profile that has seen only 42 percent growth since January 2000, driven predominantly by rents, compared to 47 percent for the CPI. The exclusion of car expenses (gas and car insurance) helps constrain long-term inflation.
Urban Renter inflation is pushed higher by an overweight in food at a restaurant, which has increased 48 percent since January 2000, and intracity public transportation, which has increased 71 percent since January 2000.
Mr. and Mrs. Wise
Mr. and Mrs. Wise, an older couple with additional medical needs, have experienced higher inflation than the CPI but lower than the EPI. The Wises start with the EPI profile, exclude certain utilities and child care, and include medical care services.
This profile puts less weight on food at a restaurant and gas, and more on prescription drugs and medical care services. The heavier than normal weight on medical services is the single largest driver of inflation for Mr. and Mrs. Wise.
Prescription drug prices have increased 62 percent since January 2000, while medical care services prices have increased 79 percent. In general, these increases have been felt most by families that spend an outsized portion of their budgets on health care.
The Wises have natural gas service for utilities, which has also driven inflation upward with 64 percent growth since January 2000. By driving less than average, however, inflation has been constrained below EPI levels.
Educated Family
The Educated Family, a middle-aged couple that is saving and spending on day care and college, has experienced much higher inflation over the last 14 years than the CPI and EPI. The profile of the Educated Family may be indicative of the price pressures that many middle-class Americans have felt.
The Educated Family profile starts with the EPI and excludes certain utilities and tobacco. The profile includes educational supplies, college tuition, and miscellaneous professional fees. The Educated Family index overweights educational supplies, college tuition, and child care. This family also heats their home with oil.
There are several extraordinary price increases that have caused the Educated Family to experience high aggregate inflation. Educational books and supplies prices have increased 122 percent, and college tuition and fees have increased 130 percent since January 2000. Child care and nursery school prices have increased 72 percent over this time.
Imagine a family that started saving for college and paying for child care when their child was young in 2000. That family may feel that the financial rug has been pulled out from under them. College tuition prices have soared in the last 14 years compared with investment vehicles such as mutual funds. This family has also felt the brunt of a massive 232 percent increase in the price of home heating oil since January 2000.
Inflation has severely affected families that have needed to pay a disproportionate amount of their budgets on child care, college tuition, and heating oil. Average weekly earnings of production and non-supervisory employees have increased only 46 percent since 2000, keeping pace with headline inflation, but significantly underperforming inflation for the Educated Family.
Inflation Differs by Category
Headline inflation numbers tell a story of modest inflation across the economy. AIER finds that Americans have varied experiences with inflation. Americans that spend a disproportionate amount of their budgets on medical services, education, child care, heating oil, or gas have likely felt increased price pressures in the last decade.
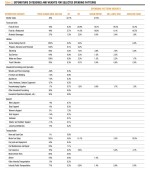
Table 2 shows expenditure category price increases since January 2000. Included in the tables are the weights for the hypothetical profiles included in this report.
If you don’t fit these profiles, AIER hopes to soon offer a personal inflation calculator. For an advance “Beta” version of this calculator, please feel free to write to info@aier.org.
The results will differ from published CPI and EPI numbers because weights are held constant instead of fluctuating over time.


