New Evidence that Soaring Inequality is a Myth
According to a dominant political narrative of the past several years, inequality in the United States is spiraling out of control. A few lonely voices, me included, have questioned the statistical foundations of this narrative, but most commentary on the subject invokes a 2016 paper by economists Emmanuel Saez and Gabriel Zucman that attempts to measure wealth concentration at the very top of the distribution.
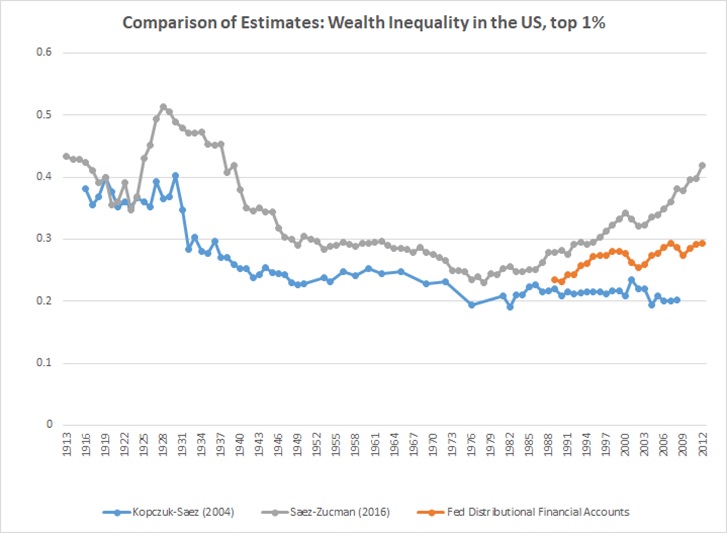
Saez and Zucman’s study points to an extreme and rapid inequality spike. They claim that the wealth share of the top 1 percent skyrocketed from 24 percent of the total share in 1980 to 42 percent today — almost doubling in a little over three decades. A new statistical measure prepared by the Federal Reserve appears to tell a very different story. It shows that wealth inequality is increasing in recent decades, but at a much more modest pace that’s less than half of the Saez-Zucman spike.
Earlier this spring, the Fed released its Distributional Financial Accounts (DFA) series of quarterly data on household wealth concentration from 1989 to the present. The series can be downloaded from their website, which also features a useful interactive tool to visualize wealth shares by percentiles. The new DFA series merges the Fed’s Survey of Consumer Finances (SCF) with the Financial Accounts of the U.S. This allows them to obtain a more fine-grained estimate than the triennial SCF previously permitted.
The more subdued rise in inequality from the DFA series occurs in fluctuations, as opposed to the sharp upward march depicted in Saez-Zucman. It shows that the top 1 percent’s wealth share increased from about 23 percent to 29 percent between 1989 and 2012 for a total rise of just 6 percentage points. By contrast, Saez-Zucman claimed a 14 percentage-point spike over the same period. While 2012 is the last available date for comparison in the Saez-Zucman series, the DFA only shows about a percentage-point increase between then and the end of 2018.
The substantial gap between the two measures also reveals two very different historical narratives. Saez and Zucman’s inequality spiral suggested that the top 1 percent’s wealth concentration has already reached a level unseen since the Great Depression, and even sits above the norm for the late Gilded Age of the 1910s and 20s. The Fed’s new DFA measure shows a recent rise in wealth concentration from a trough in the 1980s. But that rise only brings the 1 percent to parity with what Saez and Zucman’s own series depicts for the 1950s — an era that political commentators often champion as a “golden age” of greater equality in the United States.
There are a few conceptual differences between the two measures. As with earlier SCF estimates, the DFA series retains the convention of measuring wealth by households. Saez-Zucman uses tax units from its IRS-derived sources (for a discussion of the differences and an attempt to reconcile them using the SCF see here).
A side by side comparison of the DFA and Saez-Zucman nevertheless reveals the differences in their depicted trends in stark terms. The chart below depicts the DFA (red), Saez-Zucman (grey), and the older series of Kopczuk and Saez (blue), which measures individual net worth based on estate-tax records.
As can be clearly seen, only the Saez-Zucman series depicts the inequality spiral that has taken hold of the modern political conversation. The other two measures are either flat (in the case of estate taxes) or modestly rising (as in the new DFA series). While some commentators have already begun spinning the DFA as new evidence of a pressing inequality problem in the United States, the deeper story is how it actually tempers the inequality alarmism of the past several years by showing a much more subdued pattern.
The much-touted Saez-Zucman series, it would seem, is an outlier among existing measures of income and wealth concentrations at the top. The rush to embrace its depicted inequality spiral over alternative measures showing a more nuanced and tempered pattern — indeed one with less than half of the alleged rise — is indicative of how a political push to justify increased taxation has afflicted the entire inequality debate.


