August Business Conditions Monthly

AIER’s leading indicators fell back below neutral in July; second-quarter GDP posted a modest gain, but details look solid.
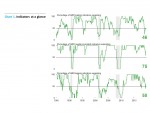
AIER’s Business Cycle Conditions Leading Indicators index pulled back slightly in July, dropping to 46 following neutral 50 readings in May and June. The Roughly Coincident Indicators index rose to 75 while the Lagging Indicators index moved back above neutral to 58 (see chart). The mixed results of the indexes reflect the uneven performance of the underlying economy and high degree of uncertainty caused by erratic trade and monetary policy.
The U.S. economy has likely set a new record for duration of expansion in July, posting 121 months of growth since the end of the last recession. Second-quarter real gross domestic product expanded at a 2.1 percent annualized pace, though the underlying details suggest stronger growth than the headline number implies.
Ongoing trade wars, erratic trade policy, and confusing monetary policy are the biggest threats to economic stability and continued expansion. The outlook remains positive, but careful monitoring of potentially destabilizing policy is warranted.
Leading Indicators index dipped back below neutral in July
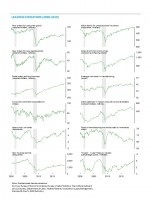
The Leading Indicators index fell to 46 last month following neutral 50 readings in May and June. The index had three changes in July among the 12 indicators. Heavy-truck unit sales moved from a positive trend to a neutral trend in the latest month. Sales have been on a solid rising trend since the end of 2016. After registering a record-tying performance in April 2019, sales have eased back in each of the last three months and are about in line with levels from the second half of 2018 and the first quarter of 2019, resulting in the move to a neutral trend. Unit sales are still near record levels, suggesting that this segment of business fixed investment remains relatively healthy. Since hitting a multidecade low during the Great Recession, unit sales have tripled. However, the path upward has not been straight. The trend in sales turned negative twice during the climb from the recession low, first in 2012, then again in 2016. It is plausible that the current transition to a neutral trend may be just a pause in the upward trend similar to those in 2012 and 2016.
The second fixed-investment indicator to weaken last month was housing permits. Permits moved from a neutral trend to a downtrend in July and have been trending flat or downward since early 2018. As discussed over the last few months, the housing market appears to be struggling with declining affordability due to elevated home prices. While affordability overall remains favorable, it has become significantly less favorable over the past few years. Despite the drop in mortgage rates in recent months, the outlook for housing remains cautious.
Debit balances in customer margin accounts was the financial indicator to change direction in July, moving from a downtrend to a neutral trend. The debit-balances indicator had been in an uptrend from mid-2016 through early 2018, hitting a record high in January 2018, but has been trending flat or downward since.
Overall, 4 of the 12 leading indicators maintained a positive trend in July, with 3 trending flat and 5 trending lower.
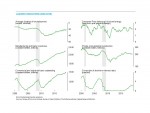
The Roughly Coincident Indicators had two changes in July as the employment-to-population ratio turned positive and consumer confidence in the present situation moved from negative to neutral. Those changes pushed the overall index to 75 from 58 in June. Continued strength in jobs creation is driving the employment-to-population ratio higher and a main reason for continued high levels of consumer confidence.
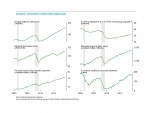
AIER’s Lagging Indicators index rose back above neutral in July to 58 following two months at 42. Only one indicator changed direction in July as duration of unemployment jumped from a downtrend to an uptrend in a single move. Overall, three indicators are trending higher, two are trending lower, and one is neutral.
Two of the three AIER business cycle indicator indexes — the Leading Indicators index and the Lagging Indicators index — remain near the neutral 50 level, reflecting the uneven performance of the economy recently. The Roughly Coincident Indicators index is comfortably above neutral but still significantly below 100. Overall, the results suggest a modestly positive outlook.
Consumer spending drove second-quarter real GDP growth
Real gross domestic product rose at a 2.1 percent annualized rate in the second quarter, down from a 3.1 percent pace in the first quarter. Growth was driven primarily by strong gains in consumer spending and government expenditures. Business fixed investment and residential investment made small negative contributions while exports and inventory change hurt growth calculations.
Consumers bounce back
Consumer spending accelerated in the second quarter, rising at a robust 4.3 percent pace, the strongest since the fourth quarter of 2017, compared to a 1.1 percent growth rate in the first quarter. The acceleration was broad-based across the major segments of consumer spending, with durable-goods spending rising 12.9 percent, nondurable-goods spending up 6.0 percent, and services gaining 2.5 percent. Consumer spending contributed 2.8 percentage points to real GDP growth versus 0.8 percentage points in the first quarter.
Business fixed investment shows pockets of strength and weakness
Real business fixed investment reduced real GDP growth by 0.1 percentage points versus a 0.6 percentage-point contribution in the first quarter. Business fixed investment fell at a 0.6 percent annualized rate in the second quarter, below the 4.4 percent pace of the first quarter. At annualized rates, the gain was led by a 4.7 percent increase in intellectual property spending while spending on equipment rose 0.7 percent.
Many categories of equipment expenditures showed gains for the quarter but were offset by a 48.4 percent annualized pace of decline in aircraft expenditures. The collapse is likely related to issues with the Boeing 777 aircraft. Excluding aircraft, equipment expenditures would have risen at a 2.6 percent rate instead of 0.7 percent.
Investment spending on nonresidential structures fell 10.6 percent following a rise of 4.0 percent in the first quarter. Spending on nonresidential structures has fallen in three of the past four quarters, and declines are broad-based among the various segments.
Housing remains weak
Residential investment, or housing, fell at a 1.5 percent pace in the second quarter compared to a 1.0 percent decline in the prior quarter. Residential investment has fallen for six consecutive quarters and eight of the last nine. Housing continues to face a challenging environment as elevated home prices hurt affordability.
Altogether, business and residential fixed investment declined at a 0.8 percent pace in the second quarter, subtracting 0.14 percentage points from total GDP growth compared to a 0.56 percentage-point contribution in the first quarter.
Inventories drag growth down
Business slowed inventory accumulation in the second quarter, reducing real GDP growth by 0.86 percentage points. In the first quarter, inventory accumulation added 0.53 percentage points to growth.
Exports remain a wildcard
Exports fell at a 5.2 percent pace while imports grew at a 0.1 percent rate (exports are a positive in the calculation of gross domestic product, while imports are a negative). Exports reduced real GDP growth by 0.63 percentage points while higher imports resulted in a 0.01 percentage-point reduction in the calculation of real GDP growth.
Within exports, goods exports declined by 5.0 percent led by a 49.0 percent drop in aircraft, while services exports fell by 5.5 percent. Like domestic fixed investment, much of the decline in goods exports is likely attributable to Boeing issues. The decline in aircraft accounted for more than three-quarters of the drop in goods exports. Excluding aircraft, goods exports would have declined by just 1.2 percent. Services exports were led downward by travel (about 60 percent of the decline in service exports) and financial services (about 25 percent of the decline in service exports).
Government spends as debt and deficits grow out of control
Government spending rose at a 5.0 percent annualized rate in the second quarter compared to a 2.9 percent increase in the first quarter, contributing 0.85 percentage points to growth. Government spending rose in nearly every category, with federal defense spending up 2.8 percent, federal nondefense spending up 15.9 percent, and state and local spending up 3.2 percent. Exploding federal deficits remain one of the most significant risks to the medium- and long-term outlook for the economy.
Private domestic demand remains solid
Real final sales to private domestic purchasers, a key measure of private domestic demand, rose at a very healthy 3.2 percent annualized rate in the second quarter, up from a 1.6 percent pace in the first quarter. Over the past four quarters, real final sales to private domestic purchasers is up at a 2.3 percent pace compared to an annualized pace of 3.0 percent since 2010.
The underlying trend in real consumer spending remains well-supported by continued job creation, rising wages, healthy consumer balance sheets, and high levels of consumer confidence. Despite the solid consumer, housing and business investment have forces restraining growth. Primary among them are erratic trade policies and an unclear monetary-policy decision-making process.
Policy remains a disaster
Policy remains a disaster across the spectrum. Trade policy continues to be erratic. Random announcements of tariffs, up and down progress on trade negotiations, and deteriorating relations around the world earn foreign policy a failing grade. The fallout can be seen in slowing global trade volumes, slowing growth, and volatile capital markets.
Fiscal policy appears nonexistent with ballooning deficits and ever-rising debt. While this would be a headline development in other periods, it’s overshadowed now by trade-policy uncertainty. Eventually the federal debt load will cause a crisis, but government has shown over and over again its inability to function unless in a crisis.
Monetary policy has joined the list of major risks. Shifts in policy combined with poor communication and the appearance of capitulating to political pressure has destroyed decades of progress toward more open, transparent, and independent monetary policy. Furthermore, the Federal Reserve is at risk of following Japan and Europe to the zero-rate policy trap, which would render monetary policy largely impotent.
Immigration policy is also in chaos. The U.S. has an aging population with slowing birth rates. Law-abiding potential workers and consumers would help boost economic growth.
Overall, incoherent, illogical, politically-motivated government policies remain the biggest risks to continued economic growth.
[pdf-embedder url=”https://www.aier.org/wp-content/uploads/2019/08/BCM-08-19_FINAL.pdf“]