Clothes and Gas Boost Everyday Prices in February

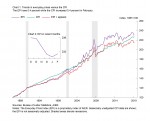
AIER’s Everyday Price Index rose 0.4 percent in February after posting four consecutive declines between October 2018 and January 2019. The Everyday Price Index measures price changes people see in everyday purchases such as groceries, restaurant meals, gasoline, and utilities. It excludes prices of infrequently purchased, big-ticket items (such as cars, appliances, and furniture) and prices contractually fixed for prolonged periods (such as housing).
The Everyday Price Index including apparel, a broader measure that includes clothing and shoes, increased 0.5 percent in February after three consecutive declines including a pair of 1.2 percent drops in November and December. Apparel prices rose 2.6 percent on a not-seasonally-adjusted basis in February but are down 0.8 percent over the past year. Apparel prices tend to be volatile, registering sporadic large gains or declines in between stretches of relatively steady prices.
Over the past 12 months, the Everyday Price Index has fallen 0.1 percent while the Everyday Price Index including apparel is down 0.2 percent. The declines in both indexes over the past year are largely due to falling energy prices.
The Consumer Price Index, which includes everyday purchases as well as infrequently purchased, big-ticket items and contractually fixed items, rose 0.4 percent in February, matching the gain in the Everyday Price Index. The Everyday Price Index is not seasonally adjusted, so we compare it with the unadjusted Consumer Price Index. Over the past year, the Consumer Price Index is up 1.5 percent.
Motor-fuel prices rose 2.7 percent for the month on a not-seasonally-adjusted basis. Over the past year, motor-fuel prices are off 8.9 percent. That decline is roughly in line with the decline in the price of crude oil. West Texas Intermediate crude has fallen from about $62 per barrel in February 2018 to about $55 per barrel last month.
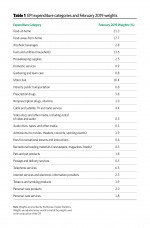
The components with the largest weights in the Everyday Price Index are food at home (weighted 21.3 percent and rising 0.3 percent in February), food away from home (17.3 percent and a 0.4 percent rise), household fuels and utilities (13.6 percent and a 0.3 percent drop), and motor fuel (10.4 percent with a 2.7 percent increase). Together, these four categories account for 63.0 percent of the Everyday Price Index.
Motor-fuel prices rose for the first time after several months of declines. Energy prices remain the most significant driver of month-to-month volatility for the Everyday Price Index. Food prices and apparel prices also showed gains for the month, but only food away from home has seen persistent increases, likely a result of rising labor costs. Labor-intensive areas such as restaurants will likely continue to see upward price pressures given the tightness of the labor market and continuing slow acceleration in average hourly earnings. A tight labor market and rising labor costs are consistent with a long economic expansion. So far, the pace of increase in consumer prices remains moderate by historical comparison, but careful monitoring is warranted.


