Energy Prices Move Lower
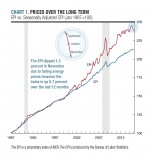
The difference between the EPI and the CPI was due to increases in shelter and medical care, which are excluded from the EPI. The price of shelter is fixed from month-to-month by mortgages and leases. Medical care is excluded from the EPI because it is not consumed on a regular basis. The EPI measures the prices of goods and services consumed on a regular basis that are not contractually fixed.
In November, energy prices decreased 5.5 percent across the board. Only propane, kerosene, and firewood registered increases. Regular grade gasoline decreased 9.1 percent and both mid-grade and premium decreased 8.1 percent. Utility bills were restrained by a 1.8 percent decrease in electricity and a 0.4 percent decrease in the price of natural gas.
Food prices were unchanged in November because lower prices at the grocery store were offset by higher prices at restaurants. The price of food consumed at home decreased 0.2 percent while prices for food consumed away from home increased 0.4 percent. Rice and pasta decreased 1.7 percent, fresh fruit decreased 2.8 percent, milk decreased 0.4 percent and the price of cheese was unchanged. Meat prices decreased 0.2 percent because a large decrease in pork prices canceled increases in beef, veal, poultry, and fish prices.
The prices of prescription drugs increased 0.4 percent in November and have increased 4.6 percent over the past 12 months. The consistent increase in the price of prescription drugs is a result of a consolidation in the pharmaceutical industry. Pharmaceutical firms have exercised market power to close the gap between brand name and generic drugs.
Over the past 12 months food prices increased 3.2 percent but many grocery cart staples increased faster. Meats, fish, poultry, and eggs increased 9.1 percent, dairy increased 5.0 percent, and fresh fruit increased 3.6 percent. On the other hand, a 10.5 percent decrease in the price of regular gasoline has helped household budgets.
By any measure, inflation remains benign around 2 percent. However consumers have endured larger price increases in food, shelter, and medical care.
About the EPI
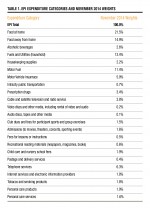
AIER’s Everyday Price Index (EPI) measures the changing prices of frequently purchased items like food and utilities. We do this by selecting the prices of goods and services from the thousands collected monthly by the Bureau of Labor Statistics in computing its Consumer Price Index. The EPI basket contains only prices of goods and services that Americans typically buy at least once a month, excluding contractually fixed purchases such as mortgages. Our staff economists weight each EPI category in proportion to its share of Americans’ average monthly expenditures. In order to better reflect the out-of-pocket prices that consumers experience on a daily basis, the EPI does not seasonally adjust prices.
To learn more about our methodology, view the weights assigned to each component, and browse past EPI updates, visit AIER’s EPI Methodology page.


