Inflation
Scorecard
Continuing last month’s trend, the AIER Inflationary Pressures Scorecard in September points to easing pressure on inflation. Of the 23 indicators tracked in the scorecard, eight support rising inflationary pressure, down from 12 last month. Nine indicators point to falling pressure and six indicate no change (Table 1).
Retail sales, an important indicator of consumer demand, slowed in the most recent three months. Meanwhile, supply, reflected by industrial production, grew at a much faster pace. Lower demand and greater supply together put downward pressure on inflation.
Key short-term interest rates stayed unchanged at near zero. This is likely to boost borrowing with the expectation of an increase in the near future. Both the money supply and consumer credit growth advanced in recent months, indicating rising inflationary pressure.
A big decline in energy prices drove down production costs, and this will put downward pressure on consumer prices for the months ahead. Import prices stabilized, even with a strong U.S. dollar. Wages and productivity remained on the path toward pushing prices down.
Consumer Price Index Analysis
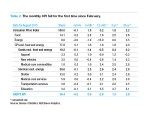
The CPI fell 0.1 percent in August from July, the first monthly decline since February 2015. The decline stemmed mainly from a 2 percent drop in energy prices. The energy price slide continues a trend—prices fell an annualized 1 percent from three months earlier and were down 15 percent from a year ago (Table 2).
Food, another volatile component of the CPI, advanced 0.2 percent from last month. Food prices were among the fastest growing items in the CPI, short term and longer range. Households paid 2.8 percent more for food compared with three months earlier and 1.6 percent more than a year ago. Households have paid an average of 2.5 percent more for food every year for the past five years. All
of these increases have outpaced the overall CPI.
Excluding the volatile food and energy categories, the core CPI rose 0.1 percent in August from July and 1.8 percent from 12 months earlier, both below the Federal Reserve’s 2 percent inflation target.
Within the core CPI, prices of goods and services behave differently. Core goods fell 0.1 percent, a fourth consecutive monthly decline since May. This implies that the slight increase in the core CPI came from the growth of core service prices.
However, the components of core goods shown in Table 2, i.e., apparel and medical-care commodities, posted strong growth for the month. The broader list of CPI components reveals that the major contributor to the decline in core good prices was information technology commodities. These fell 1.2 percent in August and were down 11.5 percent from three months earlier, the biggest three-month decline among all CPI components.
Services excluding energy rose 0.1 percent month-to-month in August. Over longer spans, core service prices grew more than 2 percent, outpacing both core goods and the overall CPI. Education became slightly cheaper in August for the first time in 12 months. However, education costs have advanced at a much faster pace than other services and goods.
Everyday Price Index
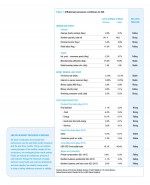
AIER’s Everyday Price Index (EPI) decreased 0.5 percent in August after registering no change in July.
The Consumer Price Index (CPI) reported by the Bureau of Labor Statistics decreased 0.1 percent in August on a not-seasonally-adjusted basis after showing no change in July. AIER’s EPI is not seasonally adjusted.
This month introduces a revised version of the EPI. To learn more about the changes, read “Capturing shifts in everyday prices” at www.aier.org/issue-briefs.
Over the past 12 months the EPI has fallen 2.8 percent while the CPI has increased 0.2 percent. The difference between the two is due to a drop in energy prices. The EPI assigns a greater weight to energy.
A decline in energy prices provided relief for consumers in August. Gasoline prices fell 5.4 percent, with regular-grade dropping 5.7 percent and premium declining 4.4 percent. Over the past 12 months gasoline prices have decreased 23.3 percent.
Other price decreases in August included internet and cable TV service. Internet service prices decreased 1.2 percent in August and have dropped 3 percent over the past 12 months. Cable TV prices decreased 0.5 percent in August but have increased 1.5 percent over the past 12 months.
https://www.aier.org/epi


