March Business Conditions Monthly


AIER’s Business Cycle Conditions Leading Indicators index rose to a reading of 92 in February returning the index to the three-year high recorded for November and December. The Roughly Coincident Indicators index held at 92 for a second month, while the Lagging Indicators index improved to 67 after a 58 reading in January and a 42 in December (see chart below). Both the Leading Indicators index and the Roughly Coincident Indicators index are holding at very high levels, consistent with ongoing expansion and a low probability of recession.
Economic data continue to suggest solid momentum for the economy. One of the key aspects of recent economic data has been the broad-based nature of the favorable results. Most areas in the economy are showing positive signs, as is reflected in our leading and coincident indicators. Broad-based growth should make the aggregate economy more resilient. However, the contrarian argument would suggest that with everything going well, few new sources of growth remain. Furthermore, the likelihood has increased that something is bound to go off track. Careful monitoring of current economic conditions is warranted.
Leading indicators suggest continued economic expansion
The AIER Leading Indicators index has been at or above 75 for 15 consecutive months and at or above the neutral 50 level for 97 of the past 102 months. The three-month average held at 90.3, the best performance since January 2014.
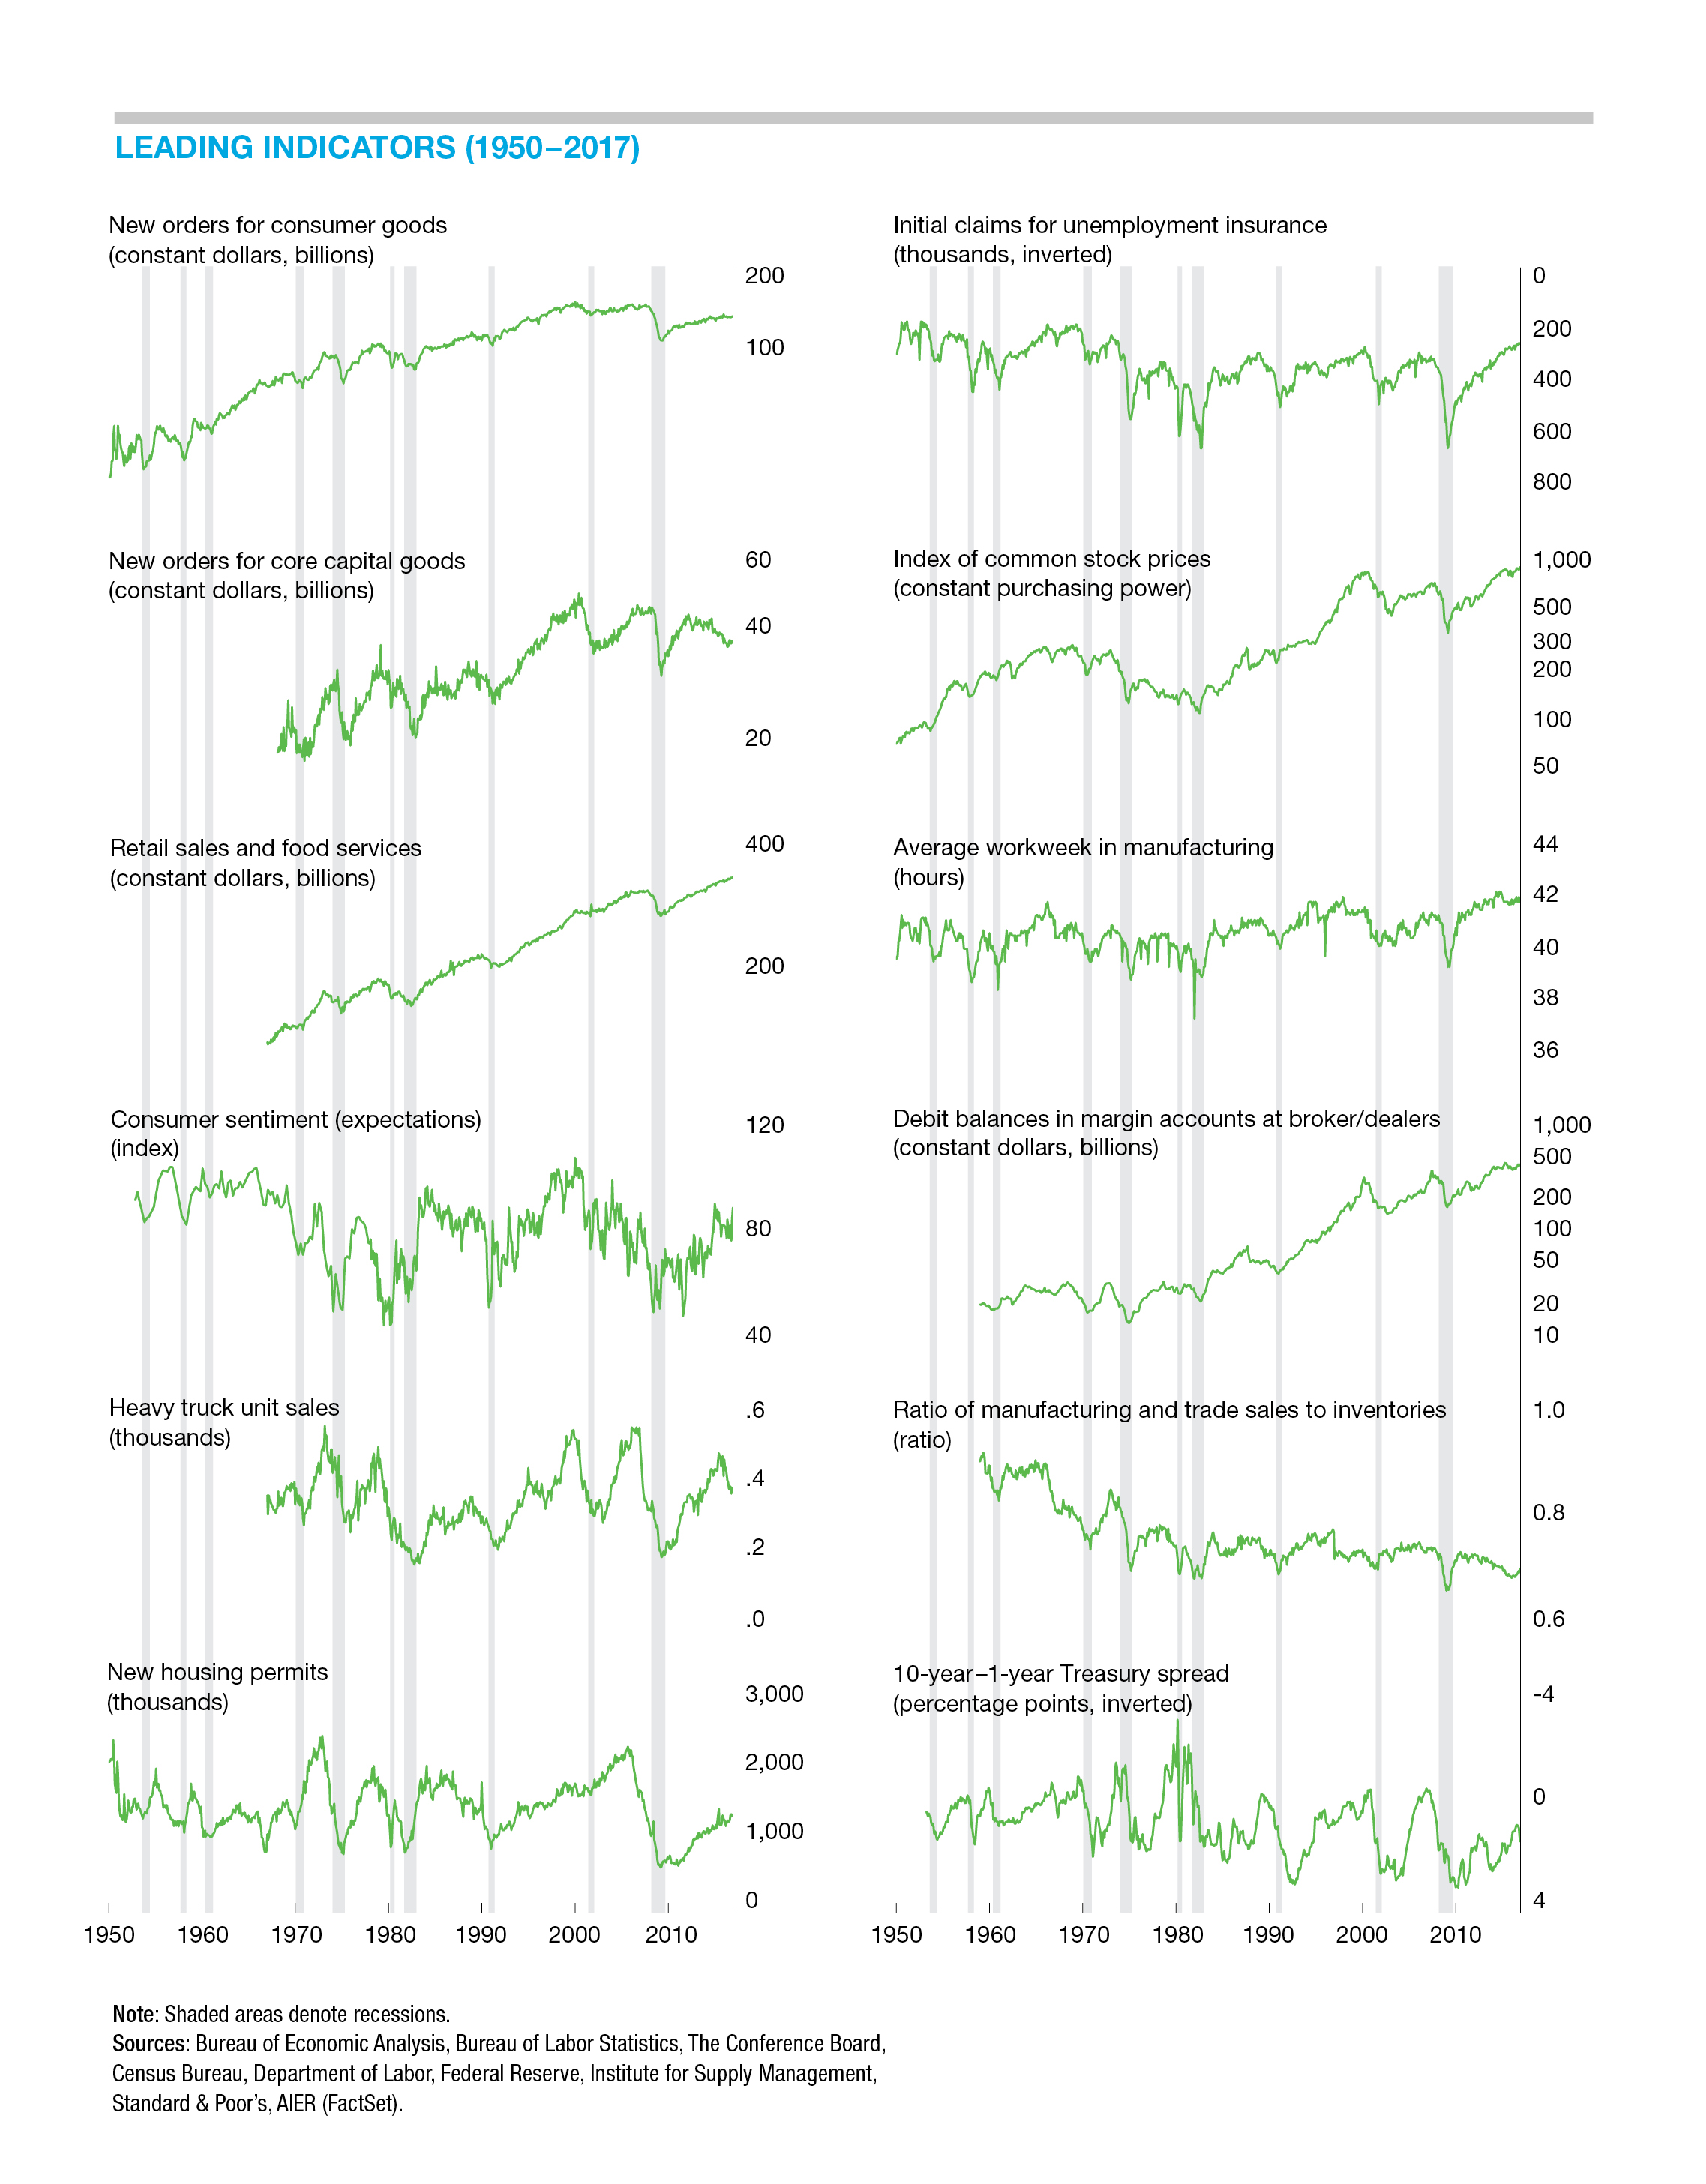
Just one indicator changed sign in February. The University of Michigan Index of Consumer Expectations improved to a positive trend from a neutral trend in January. That change puts the tally of positive indicators at 11, with only 1 declining, compared to 10 rising, 1 neutral, and 1 declining in the prior month.
The average workweek in manufacturing remained in a negative trend for February. The latest data show this indicator has been in a down trend for five consecutive months. This indicator hit an all-time high of 42.2 in 2014 and then pulled back during the economic slowdown of 2015. It regained some of the loss as the economy rebounded, hitting 42.0 in mid-2017.
However, as noted last month, the natural bound for the length of the workweek limits the ability of this indicator to stay in a positive trend indefinitely. It is very important to recognize that the average workweek is still quite long by historical measures, reflecting the renaissance in U.S. manufacturing in recent years. Further declines would make the negative trend more concerning, but for now, it may just reflect the transition to a sustained sideways trend.
The Coincident Indicators index held at 92 in February for a second month after two months at 100. The index has hit the 100 mark 9 times in the past 12 months, posting readings of 92 for the last 2 months as well as October 2017. None of the individual indicators changed signs in February, leaving five of the six coincident indicators trending higher while one, the employment-population ratio, remained in a neutral trend.
AIER’s Lagging Indicators index posted a second consecutive monthly gain in February, hitting 67 versus 58 in January and 42 in December. Overall, two indicators are trending higher, none are trending lower, and four indicators are neutral. The Lagging Indicators index is likely to show further improvement over the coming months given the solid performance of the Coincident Indicators index.
First-quarter growth shaping up to be very healthy
The U.S. economy added 313,000 jobs in February, the largest one-month gain since July 2016. Along with net upward revisions of 54,000 for the prior 2 months, the 3-month average monthly gain comes in at 242,000 and the total gain in payrolls over the past 12 months totals 2.28 million. Four of the past five months have had payroll gains above 200,000, a very healthy run.
Offsetting those gains were significant additions to the labor force. The labor force jumped by 806,000 in February, bringing the three-month average to 463,000. Those additions offset the job gains, leaving the unemployment rate at 4.1 percent for the fifth straight month. The additions to the labor force pushed the participation rate up 0.3 percentage points to 63.0, the highest since September 2017.
Gains in jobs were especially strong in goods-producing industries, which added 100,000 jobs for the month. Construction industries led the way with 61,000 new hires while durable-goods manufacturing added 32,000. Services industries added 187,000 jobs in February led by a 50,000 gain in professional and business services.
The length of the average workweek increased by 0.1 hours to 34.5 hours while average hourly earnings posted a 0.1 percent rise for the month, bringing the 12-month rise to 2.6 percent, down from 2.8 percent year-over-year in January.
The combination of payrolls, hours worked, and average hourly earnings rose by 0.7 percent in February and 4.7 percent from a year ago. This measure has been rising in the 3.5 percent to 5.0 percent range for most of the past eight years and should continue to support consumer spending.
Despite the strong pace of hiring, as of December, there were 5.8 million open jobs across the economy. That implies a job-opening rate (job openings divided by the sum of employed plus openings) of 3.8 percent. Excluding government, the openings rate for private sector industries stands at 4.1 percent, just 0.2 percentage points below the all-time high of 4.3 percent.
The strength in the labor market has helped boost net worth and consumer confidence. Household net worth stands at a record $98.7 trillion as of the end of 2017. That net worth consists of $114.4 trillion in assets and $15.6 trillion in liabilities. The ratio of household liabilities to assets is 13.7 percent, the lowest since 2000. Over the four quarters of 2017, total assets rose 7.3 percent while total liabilities rose 4.0 percent. There is some concern over the pace of liability growth for households as rising debt combined with rising interest rates could become a problem for some households and should be monitored carefully.
Consumer confidence from The Conference Board and consumer sentiment from the University of Michigan both suggest consumer attitudes are quite positive, particularly regarding the current situation. For both surveys, attitudes about the current economy are near multiyear highs. Attitudes about the future are somewhat more restrained in both surveys but still suggest a favorable outlook.
Special topic: Housing
As the spring selling season for the housing market approaches, homebuilder sentiment remains quite high. More than a dozen years since the housing market hit its peak, the different segments of the housing market have experienced varied recoveries. New multifamily-housing construction—apartments, condos, and co-ops—has returned to levels consistent with those in most of the late 1980s through mid-2008. The recovery was relatively rapid, bottoming in October 2009 and returning to average levels by the beginning of 2013. Since then, activity has plateaued in the 250,000 to 350,000 units-per-year range.
Single-family construction hit a low in March 2009 and bounced around in a depressed range for about two and a half years before beginning a sustained upward trend. Despite the upward trend in activity over the past several years, new single-family construction has yet to return to even the midpoint of the range of activity that occurred over the three and a half decades before the housing bubble. Yet homebuilder confidence is now higher than during the housing bubble.
The key dynamic behind the high level of confidence is the tight supply of existing homes on the market combined with strong consumer fundamentals and low interest rates. The supply of existing homes on the market came in at 3.4 months in January, just slightly above the all-time low of 3.1 months in December. The months’ supply was 11.3 as recently as July 2010 and hit an all-time high of 13.8 in 1982. During the housing boom, the months’ supply for existing homes generally ranged between four and five.
The tight supply is keeping a floor under the new home construction, providing an extra bit of demand from buyers that might have been looking to purchase an existing home but could not find a suitable prospect. The bottom line is that home builders remain confident as the tight supply helps boost prices of new homes and helps their own bottom line. Rising interest rates may present a headwind at some point, but for now the outlook is generally favorable.
Consumer prices vary widely
The latest data from the Bureau of Labor Statistics show the Consumer Price Index is up 2.1 percent for the 12 months ending in January 2018. The CPI has been rising close to 2 percent for the past six months, above the increases seen for most of the past five years. That rise, however, masks a range of price changes among the different goods and services within the total.
Looking at goods and services excluding food (prices often driven by weather and influences outside of economic conditions), energy (extremely volatile and driven by global influences including geopolitics), and housing (largely a contrived number), the remaining goods and services account for about 46 percent of the CPI and have risen in price at less than 2 percent per year for the past five years and less than 1 percent for the past year. These price increases have been accelerating a bit recently, but the pace of increase remains extremely low.
Prices at grocery stores were falling from the end of 2015 through mid-2017 and are now up about 1 percent over the past year. Prices at restaurants have been rising more quickly, rising between 2 and 3 percent per year since mid-2011. As of December 2017, groceries accounted for about 7.4 percent of the CPI while restaurants accounted for about 6 percent.
Energy prices are extremely volatile, rising 5.5 percent over the 12 months through January. Energy accounts for about 7.5 percent of the total CPI, not including indirect influences on the prices of goods and services such as transportation services. Price trends in the energy components of the CPI are driven largely by the price of crude oil, which itself is subject to influences from the OPEC cartel as well as the development of new technologies such as horizontal drilling. Over the past 10 years, the price of West Texas Intermediate crude has been as high as $145 per barrel and as low as $26. Such swings wreak havoc on the CPI’s stability. Over the long term, it seems probable that oil will play a declining role in energy consumption as alternative sources are developed.
Housing is the largest single component in the CPI. Rent of shelter is 32 percent of the total with owners’ equivalent rent accounting for 24 percent of the total. Owners’ equivalent rent is what homeowners would pay to rent their houses to themselves. It is completely contrived, based on what actual renters are paying to rent. Thus, about quarter of the CPI rest on no underlying transactions. Importantly, this component has been rising at a 3.2 percent pace over the past year and well above the Fed’s 2 percent target for most of the past 50 years.
Persistent increases in the general price level are extremely harmful. And understanding the dynamics of prices, relative price changes versus absolute prices changes, how prices are measured, and how the measurements are interpreted is critically important.
[pdf-embedder url=”https://www.aier.org/wp-content/uploads/2018/03/BCM_March_2018.pdf“]Robert Hughes

Robert Hughes joined AIER in 2013 following more than 25 years in economic and financial markets research on Wall Street. Bob was formerly the head of Global Equity Strategy for Brown Brothers Harriman, where he developed equity investment strategy combining top-down macro analysis with bottom-up fundamentals. Prior to BBH, Bob was a Senior Equity Strategist for State Street Global Markets, Senior Economic Strategist with Prudential Equity Group and Senior Economist and Financial Markets Analyst for Citicorp Investment Services. Bob has a MA in economics from Fordham University and a BS in business from Lehigh University.


